Additional series
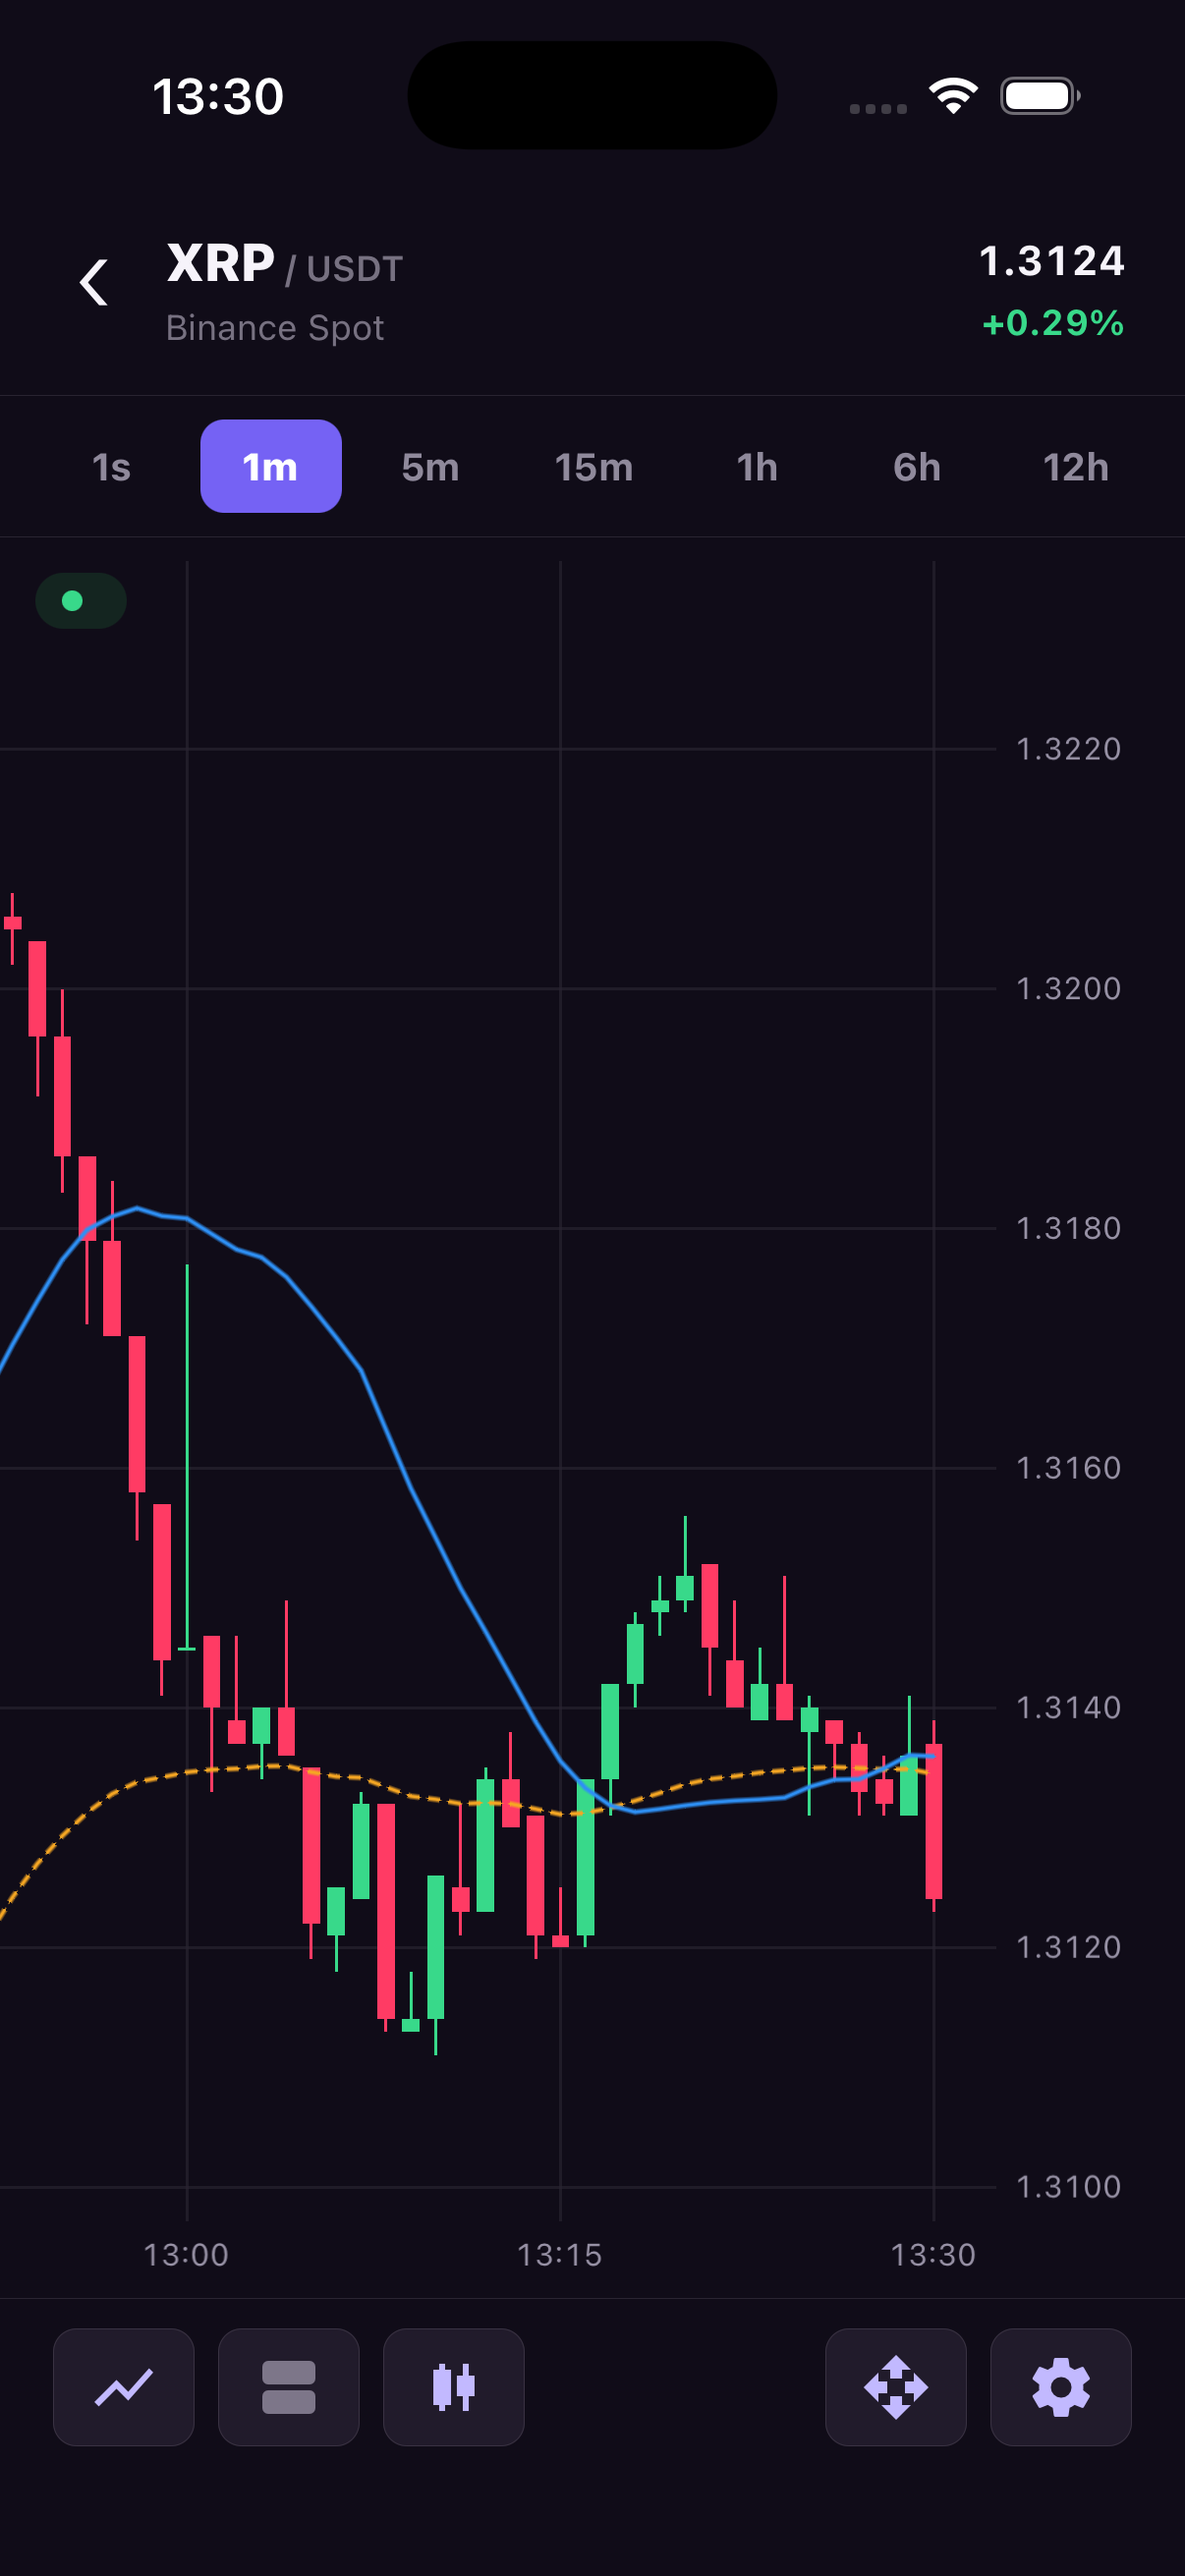
An additional series puts another set of values on the same chart. Use one to overlay a moving average on price, compare two instruments, or show volume below the candles. The main series keeps its own data and remains the chart's time reference.
There are two ways to supply those values. A comparison line has its own OHLC history, which your app loads and updates. An indicator such as SMA or RSI derives its values from an existing OHLC series and follows that source's updates automatically.
Declare series in the additionalSeries prop when they are part of the screen's layout. Use TradingCharts.addSeries and removeSeries when users need to add or remove them, for example from an indicator picker. Each series needs its own seriesId and a target pane. A price comparison can share the main pane; values with different units, such as volume, usually need a separate pane and scale.
Configuration
| Property | Type / values | Default | Description |
|---|---|---|---|
seriesId | Unique non-empty string except main | Required | Runtime/declarative series identifier. |
paneId | Existing pane ID | Required | Target pane. |
priceScaleId | Target pane's scale ID | Required | Must match the pane price scale. |
visible | boolean | true | Controls rendering without removing the series. |
type | 'candlestick', 'hollowCandlestick', 'bar', 'line', 'area', 'histogram', 'macd', 'boll' | Required | Series geometry or composite indicator. |
source | OHLC field, derived indicator, or histogram source | Type-specific | Line/area value field or native-derived/data source. |
gapThresholdMs | Positive milliseconds | undefined | Optional line/area gap splitting. |
appearance | Type-specific style | Theme fallback | Optional line, area, or histogram style. |
Derived volume follows its OHLC source automatically when history, candle, or trade updates arrive. Standalone series use setSeriesData, prependSeriesData, and updateSeriesData.
Identifiers accept letters, numbers, ., _ and -. main is reserved. Target a declared pane and its matching price scale. The main pane exists by default; declare any extra pane before adding series to it.
Runtime comparison series
The example loads a comparison line with its own OHLC history. Its button removes that line while leaving the main chart in place.
import { useEffect } from 'react';
import { Button, View } from 'react-native';
import {
  TradingCharts,
  TradingChartsView,
  type OhlcCandle,
} from 'react-native-trading-charts';

// Deterministic sample data. Replace this with your market-data feed.
const history: OhlcCandle[] = Array.from({ length: 80 }, (_, index) => {
  const open = 100 + Math.sin(index / 5) * 8;
  const close = 100 + Math.sin((index + 1) / 5) * 8;
  return {
    timestamp: 1_720_000_000_000 + index * 60_000,
    open,
    high: Math.max(open, close) + 2,
    low: Math.min(open, close) - 2,
    close,
    volume: 10 + index,
  };
});

const chartId = 'additional-series';

export function Example() {
  useEffect(() => {
    TradingCharts.setHistory(chartId, history);
    TradingCharts.addSeries(chartId, {
      seriesId: 'comparison',
      type: 'line',
      paneId: 'main',
      priceScaleId: 'main',
      source: 'close',
      appearance: { color: '#F5A623', width: 2, style: 'dashed' },
    });
    TradingCharts.setSeriesData(
      chartId,
      'comparison',
      history.map((candle) => ({
        ...candle,
        open: candle.open + 3,
        high: candle.high + 3,
        low: candle.low + 3,
        close: candle.close + 3,
      }))
    );
  }, []);

  return (
    <View>
      <TradingChartsView style={{ height: 420 }} chartId={chartId} />
      <Button
        title="Remove comparison"
        onPress={() => TradingCharts.removeSeries(chartId, 'comparison')}
      />
    </View>
  );
}
Data ownership
OHLC-backed line and area series still receive full OhlcCandle objects. Standalone histograms receive HistogramPoint objects. Use setSeriesData, prependSeriesData and updateSeriesData to load, prepend and update data-backed series. Derived volume and indicators follow their OHLC source; do not write data directly into them.
Use the additionalSeries prop for series declared in React, as in the indicator guides. When you also add or remove series through commands, keep that prop consistent with the layout you want. The prop configures series; data updates still go through the command API. Set visible: false to hide a series without removing it.
See Bollinger Bands for a three-line price overlay with a gradient fill and configurable period, deviation multiplier, and OHLC source.
See Parabolic SAR for a price overlay with hollow circles, configurable acceleration and three trend/reversal colors.
Baseline series support both fixed-price and pane-percentage bases, with separate outline and gradient colors above and below the level. They accept OHLC data and can be added declaratively or with addSeries().