Crosshair & tooltips
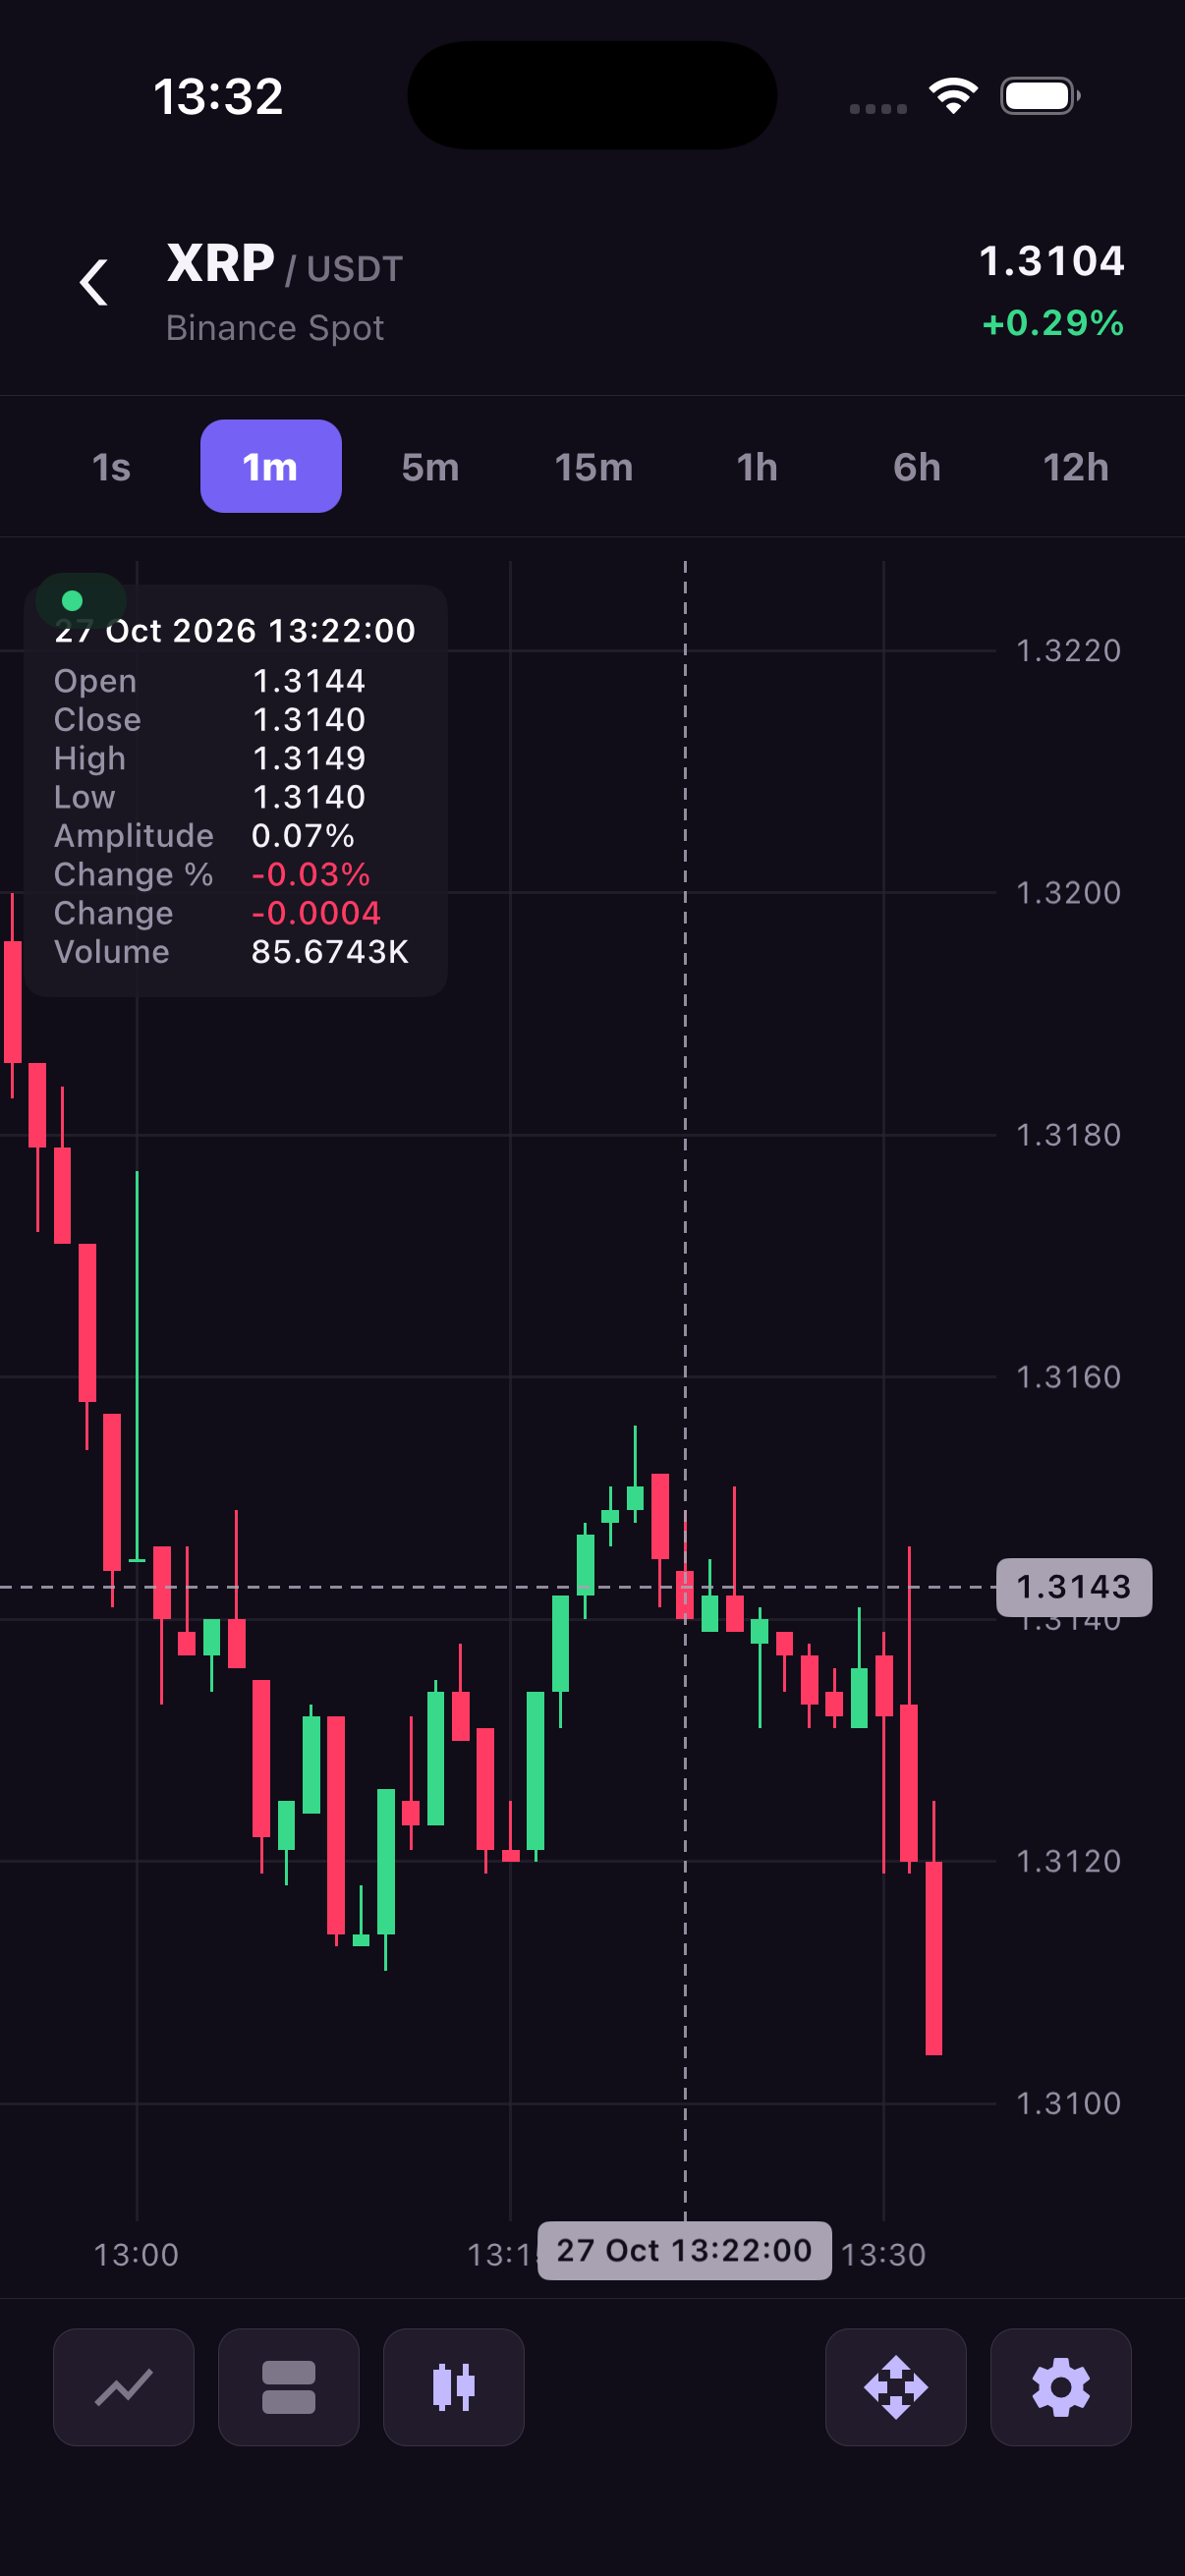
A crosshair lets users inspect one candle without estimating its value from the axes. Its lines mark the selected time and price, while a tooltip can show that candle's open, high, low, close and volume.
Use the built-in tooltip when those values belong on the chart. If your screen has its own detail panel, handle onSelectedCandleChange and show the selected values there. You can hide the built-in tooltip while keeping the selection interaction.
Tap once to pin the crosshair to the nearest candle, drag to move it, and tap again to clear it. A long press follows the finger and keeps the selection pinned after release. The options below control the lines, labels and tooltip fields.
Crosshair
| Property | Type / values | Default | Description |
|---|---|---|---|
enabled | boolean | true | Enables selection gestures and crosshair rendering. |
showTooltip | boolean | true | Shows the OHLCV tooltip. |
showTooltipHeader | boolean | true | Shows the formatted date/time heading. |
tooltipBackgroundOpacity | Number from 0 to 1 | 1 | Legacy tooltip opacity and appearance fallback. |
lineStyle | 'solid', 'dashed' | 'solid' | Crosshair line pattern. |
tooltipFields | ReadonlyArray<CrosshairTooltipField> | All fields in the order below | Selects and orders tooltip rows. Unknown or duplicate fields are rejected; an empty array is allowed. |
tooltipLabels | CrosshairTooltipLabels | English labels | Localizes tooltip row labels. |
| Tooltip label property | Default | Description |
|---|---|---|
open / close / high / low | Open / Close / High / Low | OHLC row labels. |
amplitude | Amplitude | High-low amplitude label. |
changePercent | Change % | Percentage change from open. |
change | Change | Absolute change from open. |
volume | Volume | Volume row label. |
When the candle opens at zero, the tooltip shows an em dash for percentages because the relative change cannot be calculated. Volume uses a compact format without the Y-axis currency symbol. When tooltipFields is empty, the tooltip contains only its header. If showTooltipHeader is also false, no tooltip panel is drawn even when showTooltip is true.
import { useEffect } from 'react';
import {
  TradingCharts,
  TradingChartsView,
  type OhlcCandle,
} from 'react-native-trading-charts';

// Deterministic sample data. Replace this with your market-data feed.
const history: OhlcCandle[] = Array.from({ length: 80 }, (_, index) => {
  const open = 100 + Math.sin(index / 5) * 8;
  const close = 100 + Math.sin((index + 1) / 5) * 8;
  return {
    timestamp: 1_720_000_000_000 + index * 60_000,
    open,
    high: Math.max(open, close) + 2,
    low: Math.min(open, close) - 2,
    close,
    volume: 10 + index,
  };
});

const chartId = 'crosshair';

export function Example() {
  useEffect(() => {
    TradingCharts.setHistory(chartId, history);
  }, []);

  return (
    <TradingChartsView
      style={{ height: 480 }}
      chartId={chartId}
      appearance={{
        candles: { radius: 3 },
        currentPrice: { label: { border: { radius: 7 } } },
      }}
      crosshair={{
        tooltipFields: ['close', 'changePercent', 'volume'],
        showTooltipHeader: false,
      }}
    />
  );
}