Custom price markers
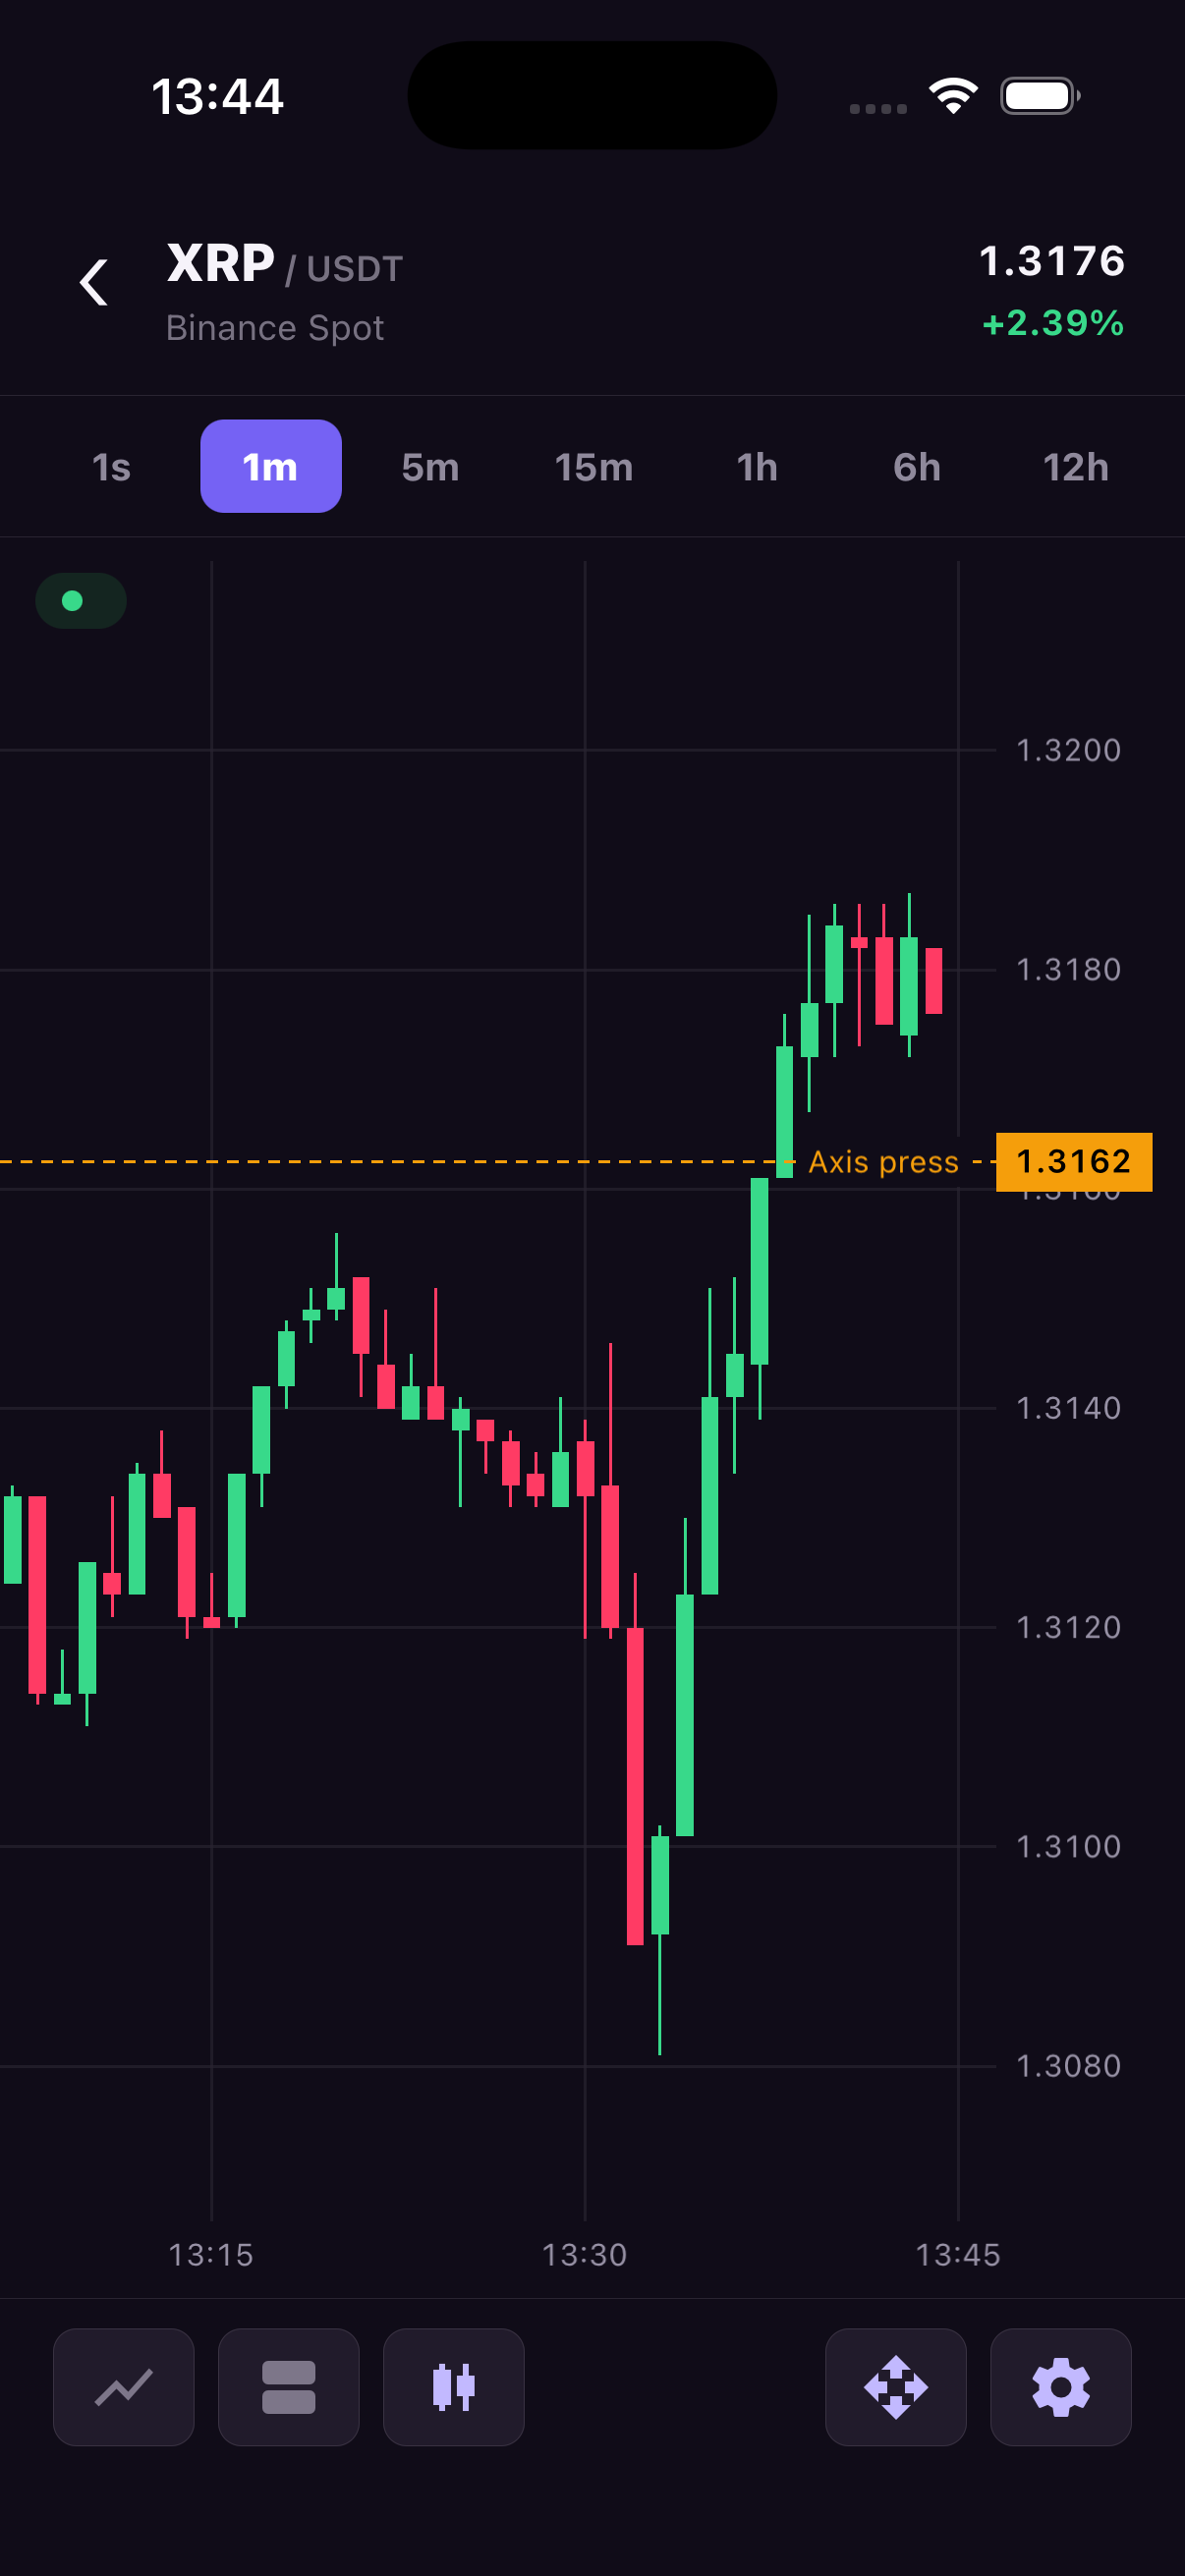
A custom price marker draws a horizontal line and an axis label at a price chosen by your app. For example, an order screen can show an entry price or a target next to the market candles, so users can see where it falls on the chart.
Create the marker with setPriceLine and give it a stable ID, such as the order's ID. Updating that ID moves or relabels the existing marker; removing it clears the line. Markers belong to the main price pane, and your app decides which prices to display and how long to keep them.
The example below creates a target, updates it from a button, and lets users place another marker by tapping the price axis.
Create, update and remove
Calling setPriceLine with an existing ID updates it without changing insertion order. The example also adds a marker when the user taps the main Y-axis. Taps on other pane axes are deliberately ignored because markers always belong to the main pane.
import { useEffect } from 'react';
import { Button, View } from 'react-native';
import {
  TradingCharts,
  TradingChartsView,
  type OhlcCandle,
} from 'react-native-trading-charts';

// Deterministic sample data. Replace this with your market-data feed.
const history: OhlcCandle[] = Array.from({ length: 80 }, (_, index) => {
  const open = 100 + Math.sin(index / 5) * 8;
  const close = 100 + Math.sin((index + 1) / 5) * 8;
  return {
    timestamp: 1_720_000_000_000 + index * 60_000,
    open,
    high: Math.max(open, close) + 2,
    low: Math.min(open, close) - 2,
    close,
    volume: 10 + index,
  };
});

const chartId = 'price-markers';

export function Example() {
  useEffect(() => {
    TradingCharts.setHistory(chartId, history);
    TradingCharts.setPriceLine(chartId, {
      id: 'target',
      price: 105,
      label: 'Target',
      color: '#FF9457',
    });
  }, []);

  return (
    <View>
      <TradingChartsView
        style={{ height: 420 }}
        chartId={chartId}
        appearance={{ priceLines: { label: { border: { radius: 6 } } } }}
        onYAxisPress={({ price, paneId }) => {
          if (paneId !== 'main') return;
          TradingCharts.setPriceLine(chartId, {
            id: 'selected-price',
            price,
            label: 'Selected price',
            color: '#2CBFAE',
          });
        }}
      />
      <Button
        title="Update target"
        onPress={() =>
          TradingCharts.setPriceLine(chartId, {
            id: 'target',
            price: 107,
            label: 'Updated target',
            color: '#F5A623',
          })
        }
      />
      <Button
        title="Remove target"
        onPress={() => TradingCharts.removePriceLine(chartId, 'target')}
      />
      <Button
        title="Clear markers"
        onPress={() => TradingCharts.clearPriceLines(chartId)}
      />
    </View>
  );
}
Options and styling
| Property | Type | Default / constraints |
|---|---|---|
id | string | Required, non-blank; application-owned identifier. |
price | number | Required, finite. |
label | string | Required, non-blank. |
color | string | Required, #RRGGBB or #RRGGBBAA. |
Set appearance.priceLines.label.border.radius to a non-negative number (default 0) for all custom marker badges. The current-price badge has its own style under appearance.currentPrice.label.
Read markers
await TradingCharts.getPriceLines(chartId) returns all stored markers in insertion order, including off-screen ones. It rejects with E_CHART_NOT_MOUNTED if no native view is registered. See the read example.
Visibility and lifetime
Markers do not affect autoscale. A marker renders only inside the visible main price range and while the main Y-axis is visible. clear(chartId) clears market data but preserves markers; clearPriceLines(chartId) removes them. Destroying the native view does not persist markers: keep persistent application state separately.