Volume & histograms
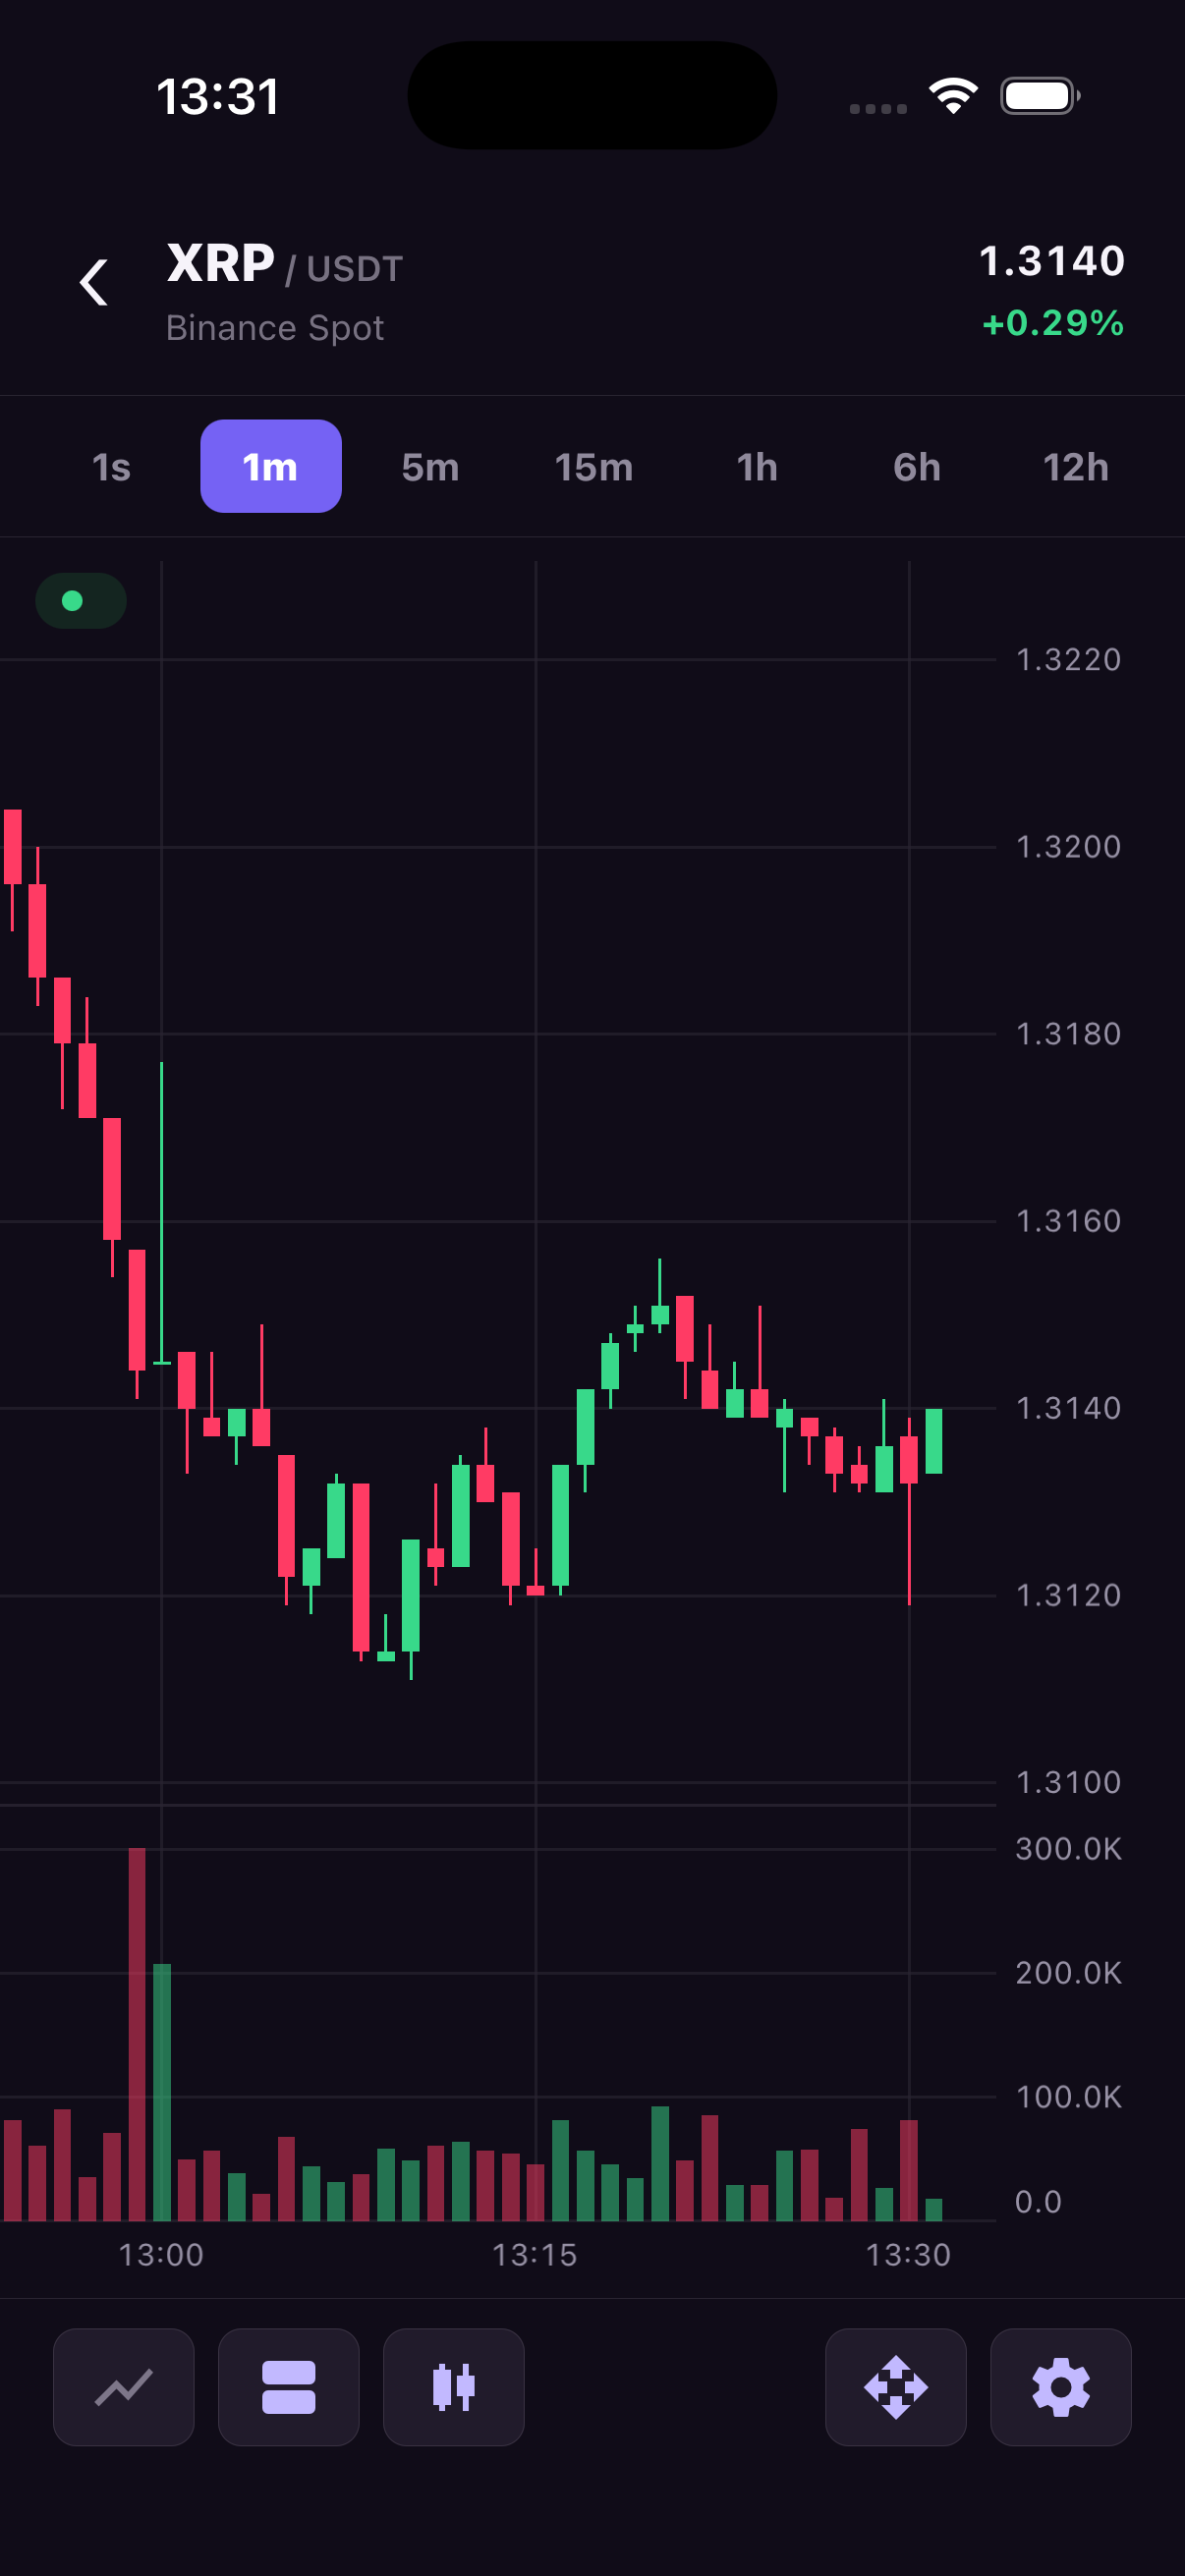
Volume tells you how much traded during each candle. Showing it below price lets users compare price changes with trading activity at the same time. A histogram draws one vertical bar per timestamp, with bar height representing the value.
If your candles include volume, the library can derive these bars from the OHLC series. You do not need to keep a second copy of the volume data in JavaScript. For a value you calculate yourself, such as volume delta, supply independent HistogramPoint objects instead. Those points can be positive or negative.
Histograms are additional series. Put them in a separate pane when their units differ from price, and give that pane an appropriate number format. The options below cover both derived volume and independent values.
| Property | Type / values | Default | Description |
|---|---|---|---|
type | 'histogram' | Required | Selects histogram geometry. |
source | { type: 'data' } or { type: 'ohlcvVolume', seriesId } | { type: 'data' } | Uses standalone points or derives volume from an OHLC series. |
appearance.color | Color | theme.axisTextColor | Color for standalone positive/negative values when directional colors are not selected by derived OHLC volume. |
appearance.upColor | Color | theme.upColor | Derived-volume color when source candle closes up. |
appearance.downColor | Color | theme.downColor | Derived-volume color when source candle closes down. |
Derive volume from candles
The following chart declares both panes and the source series. Updates to main OHLCV data automatically update volume.
import { useEffect } from 'react';
import {
  TradingCharts,
  TradingChartsView,
  type OhlcCandle,
  type ChartPaneOptions,
} from 'react-native-trading-charts';

// Deterministic sample data. Replace this with your market-data feed.
const history: OhlcCandle[] = Array.from({ length: 80 }, (_, index) => {
  const open = 100 + Math.sin(index / 5) * 8;
  const close = 100 + Math.sin((index + 1) / 5) * 8;
  return {
    timestamp: 1_720_000_000_000 + index * 60_000,
    open,
    high: Math.max(open, close) + 2,
    low: Math.min(open, close) - 2,
    close,
    volume: 10 + index,
  };
});

const chartId = 'volume';
const panes: ChartPaneOptions[] = [
  {
    paneId: 'main',
    heightWeight: 3,
    priceScale: { priceScaleId: 'main' },
  },
  {
    paneId: 'volume',
    heightWeight: 1,
    minHeight: 56,
    priceScale: {
      priceScaleId: 'volume',
      valueFormat: { type: 'volume', precision: 1 },
    },
  },
];

export function Example() {
  useEffect(() => {
    TradingCharts.setHistory(chartId, history);
  }, []);

  return (
    <TradingChartsView
      style={{ height: 480 }}
      chartId={chartId}
      panes={panes}
      panesResizable
      additionalSeries={[
        {
          seriesId: 'volume',
          type: 'histogram',
          paneId: 'volume',
          priceScaleId: 'volume',
          source: { type: 'ohlcvVolume', seriesId: 'main' },
        },
      ]}
    />
  );
}
Standalone histogram
Use source: { type: 'data' } for independent positive or negative values. These are scalar points, not OHLC candles.
import { useEffect } from 'react';
import {
  TradingCharts,
  TradingChartsView,
  type OhlcCandle,
  type ChartPaneOptions,
} from 'react-native-trading-charts';

// Deterministic sample data. Replace this with your market-data feed.
const history: OhlcCandle[] = Array.from({ length: 80 }, (_, index) => {
  const open = 100 + Math.sin(index / 5) * 8;
  const close = 100 + Math.sin((index + 1) / 5) * 8;
  return {
    timestamp: 1_720_000_000_000 + index * 60_000,
    open,
    high: Math.max(open, close) + 2,
    low: Math.min(open, close) - 2,
    close,
    volume: 10 + index,
  };
});

const chartId = 'histogram';
const panes: ChartPaneOptions[] = [
  { paneId: 'main', heightWeight: 3, priceScale: { priceScaleId: 'main' } },
  { paneId: 'delta', heightWeight: 1, priceScale: { priceScaleId: 'delta' } },
];

export function Example() {
  useEffect(() => {
    TradingCharts.setHistory(chartId, history);
    TradingCharts.addSeries(chartId, {
      seriesId: 'delta',
      type: 'histogram',
      paneId: 'delta',
      priceScaleId: 'delta',
      source: { type: 'data' },
      appearance: { color: '#8C7CFF' },
    });
    TradingCharts.setSeriesData(
      chartId,
      'delta',
      history.map((candle, index) => ({
        timestamp: candle.timestamp,
        value: Math.sin(index / 5) * 20,
      }))
    );
  }, []);

  return (
    <TradingChartsView
      style={{ height: 480 }}
      chartId={chartId}
      panes={panes}
    />
  );
}
Histograms are additional series only. A standalone histogram uses appearance.color; upColor and downColor are used for direction from a derived OHLC volume source. Configure pane valueFormat with type: 'volume' to format volume labels.