Installation & first chart
This guide takes you from installing the package to a chart with visible candles. You will add the native dependency, rebuild the app and render a React component with sample history. You can connect your own feed after that first chart works.
The example uses a fixed height and a stable chart ID. Both matter: the view needs space to draw, and data commands use the ID to find the correct chart.
Requirements
Use React Native 0.80 or newer with New Architecture / Fabric enabled. The library targets iOS 15.1+ and Android API 24+. Its iOS code requires Xcode 15+ and Swift 5.9+. Your app's React Native version may require newer OS or toolchain versions; follow the stricter requirement.
Install
Install with your project's package manager:
npm install react-native-trading-chartsOr, with Yarn:
yarn add react-native-trading-chartsFor iOS, install the CocoaPods dependencies from your app's directory:
cd ios
pod install
cd ..
The pod enables Swift/C++ interop for its own target. You do not need to enable it on your app target or import a C++ module.
Rebuild the native app
Rebuild with your app's iOS or Android run command. In a React Native CLI app, these are commonly yarn ios and yarn android. A Metro reload cannot install the native module.
For Expo, use a development build that includes this library. Expo Go does not contain this native component.
Render your first chart
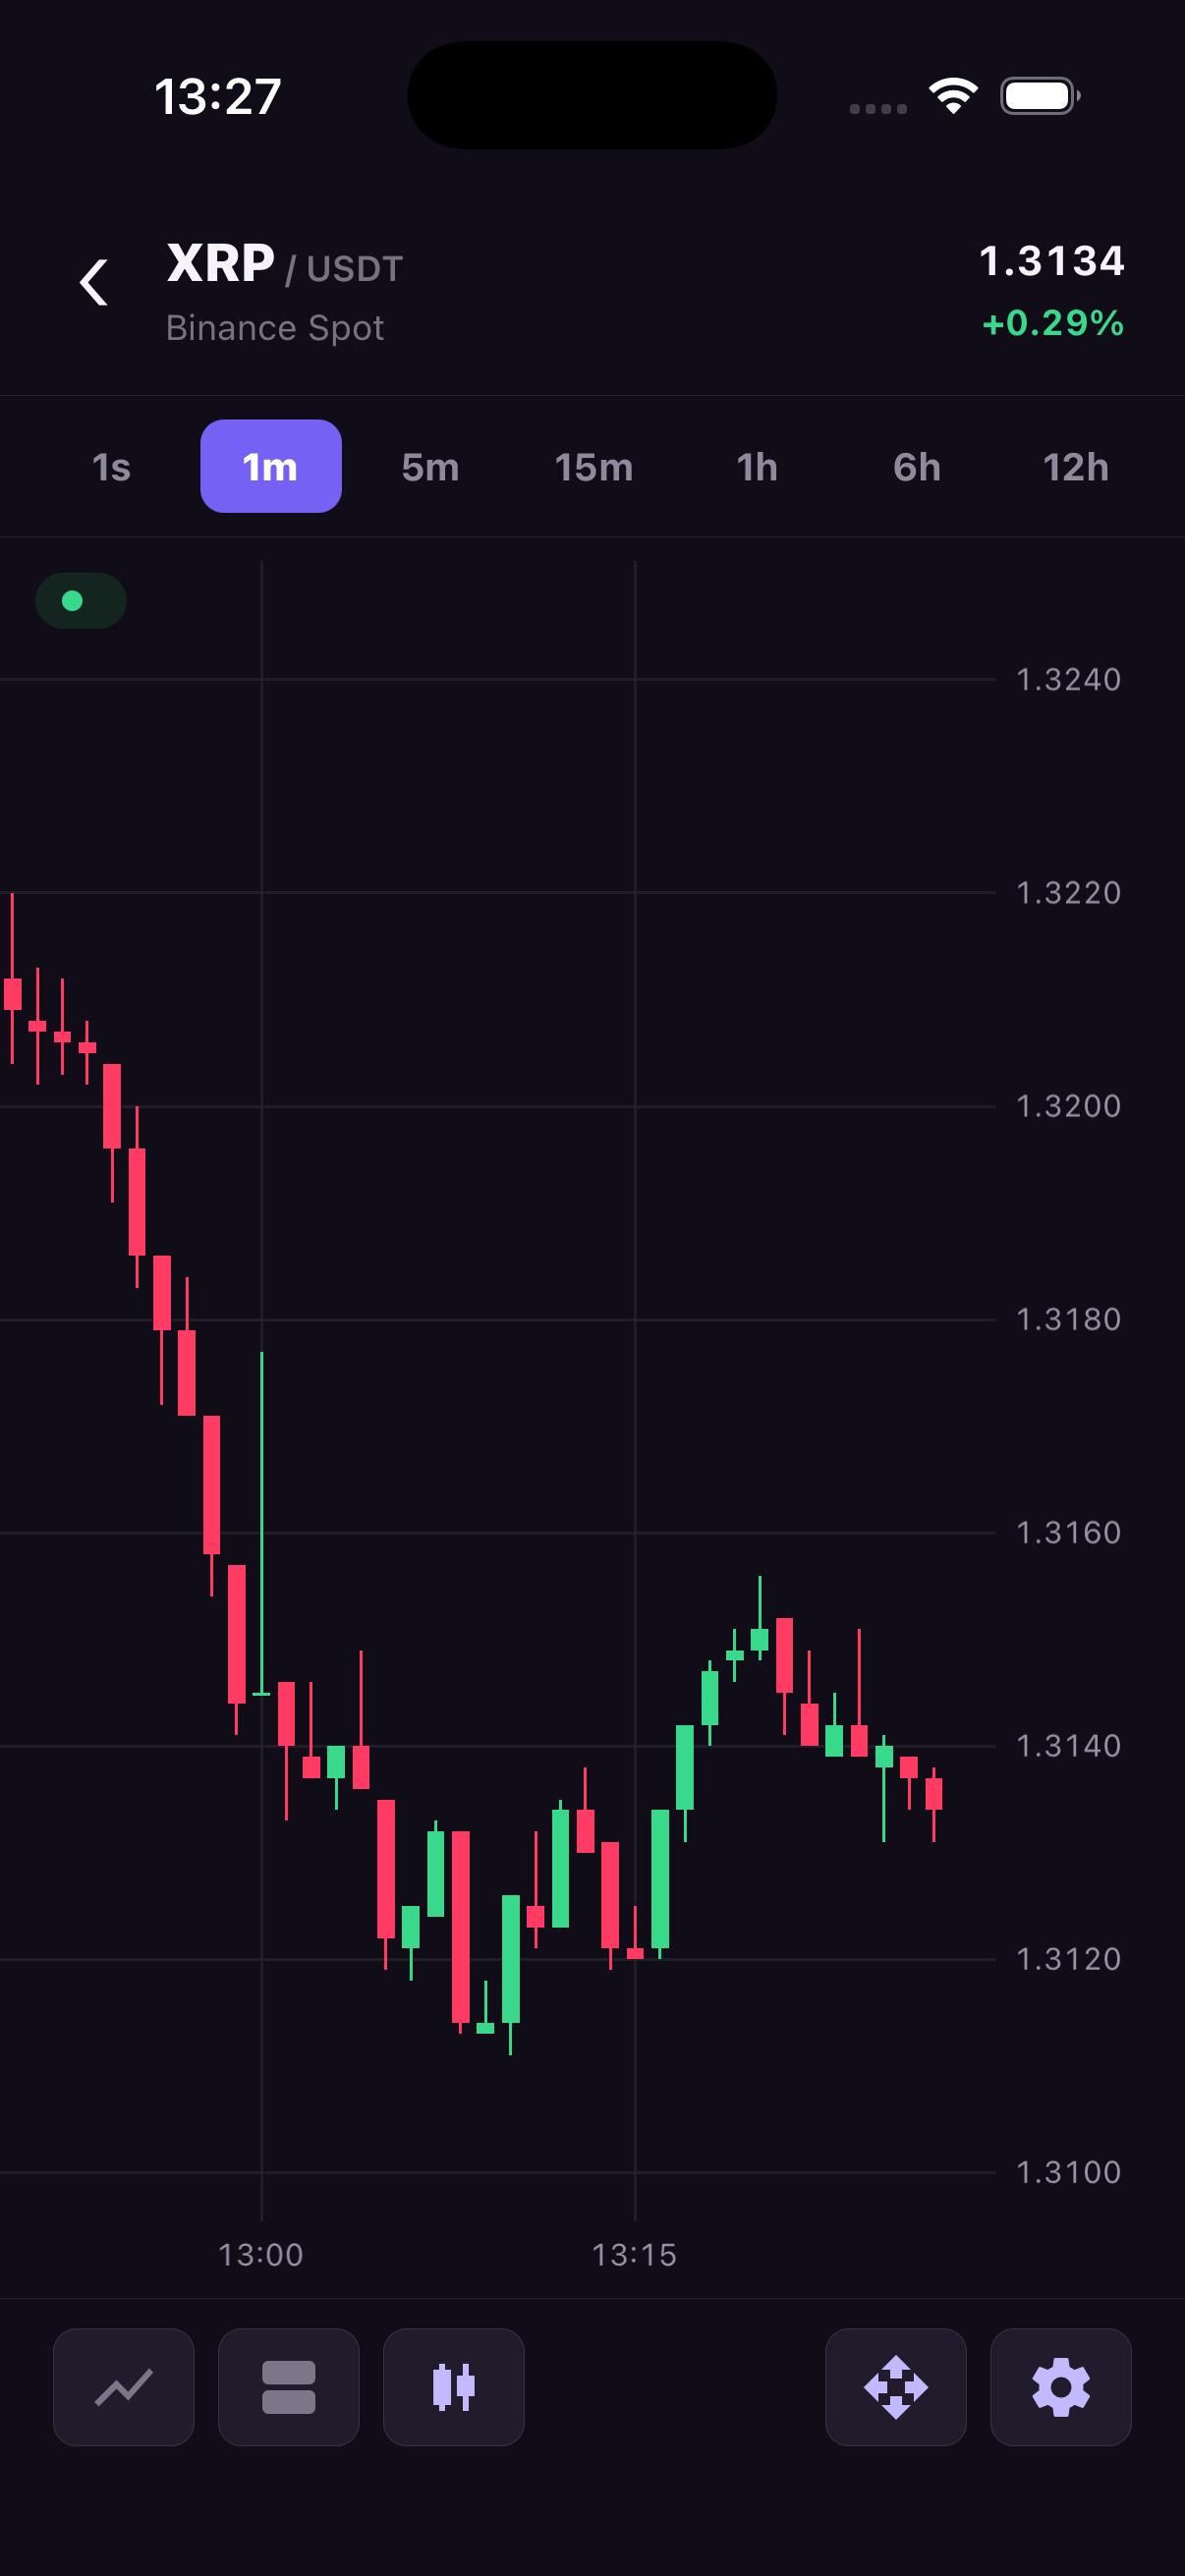
Copy this component into a native screen. It creates sample candles and loads them into a chart with a fixed height. Replace the sample data with your feed once it renders.
import { useEffect } from 'react';
import {
  TradingCharts,
  TradingChartsView,
  type OhlcCandle,
} from 'react-native-trading-charts';

// Deterministic sample data. Replace this with your market-data feed.
const history: OhlcCandle[] = Array.from({ length: 80 }, (_, index) => {
  const open = 100 + Math.sin(index / 5) * 8;
  const close = 100 + Math.sin((index + 1) / 5) * 8;
  return {
    timestamp: 1_720_000_000_000 + index * 60_000,
    open,
    high: Math.max(open, close) + 2,
    low: Math.min(open, close) - 2,
    close,
    volume: 10 + index,
  };
});

const chartId = 'first-chart';

export function Example() {
  useEffect(() => {
    TradingCharts.setHistory(chartId, history);
  }, []);

  return (
    <TradingChartsView
      style={{ height: 420 }}
      chartId={chartId}
      resolution={{ unit: 'minute' }}
      series={{ type: 'candlestick' }}
    />
  );
}
Connect data and commands
chartId routes commands to the matching view. Keep it stable while mounted and unique across simultaneous charts. Writes sent before mount enter a bounded replay queue; reads require a mounted chart.
Load the initial candles with setHistory. Then use updateCandle for candle updates or updateTrades for raw trades. Data & streaming explains how to choose between them and load older history.
If the chart is blank
Check that the container has a height, commands use the view's chartId, and timestamps are in milliseconds. After installing the package, rebuild the native app before reloading JavaScript.