MACD
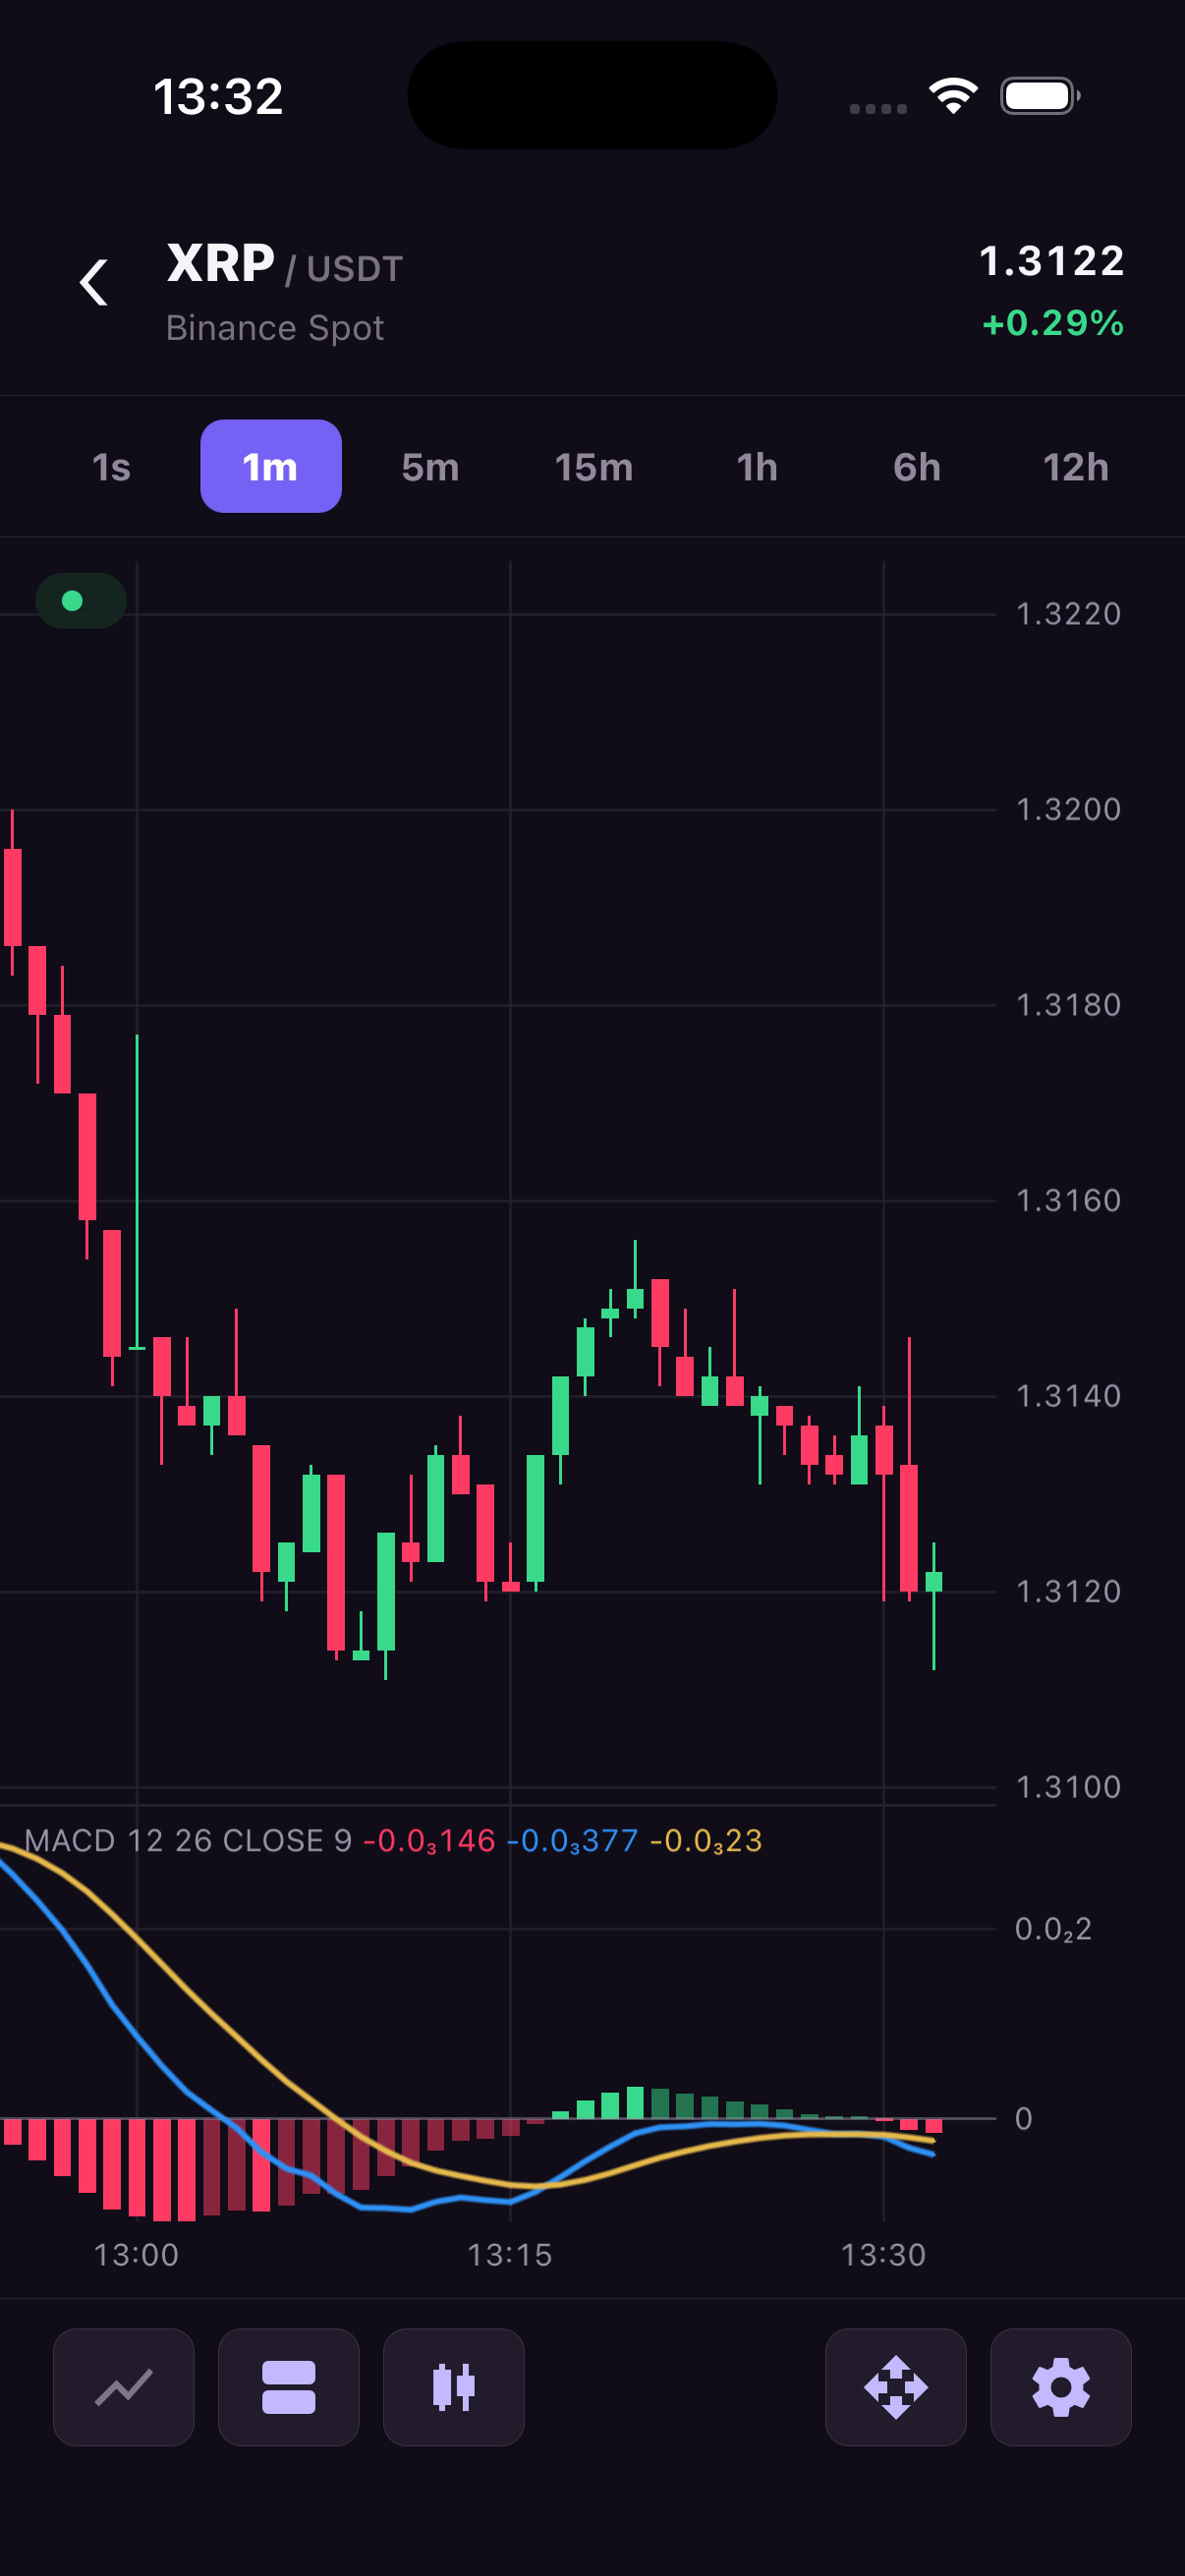
Moving Average Convergence Divergence (MACD) shows the difference between a faster and a slower exponential moving average. Its signal line smooths that difference, and its histogram shows the distance between the MACD and signal lines. A separate pane lets users inspect these changes alongside the price candles.
Add MACD as one additional series. The library calculates and draws both lines, the histogram and zero line, and supplies the pane's scale and legend. You can style each component without creating separate series IDs for them.
Calculation and source requirements
The formulas are MACD = EMA(fast) - EMA(slow), signal = EMA(MACD, signalPeriod), and histogram = MACD - signal. Each EMA starts with a simple moving average. Defaults are 12/26/9 and close; periods must be positive unsigned integers and fastPeriod < slowPeriod. The MACD line begins at candle index slowPeriod - 1. The signal line and histogram begin at slowPeriod + signalPeriod - 2, once enough MACD values exist. gapThresholdMs splits both lines across time gaps without resetting the EMAs.
MACD needs a pane separate from main and cannot share it with RSI. Its source must be main or another series with its own OHLC data. The library rejects derived indicators as sources and direct data writes to MACD. Update its source instead. Removing the MACD series removes all its components.
Read the histogram and legend
A non-negative histogram value uses positiveIncreasingColor when it is greater than the previous value, and positiveDecreasingColor otherwise. A negative value uses negativeIncreasingColor when it is greater than the previous value, and negativeDecreasingColor otherwise. The first bar uses positiveIncreasingColor or negativeDecreasingColor, according to its sign.
The legend reads MACD 12 26 CLOSE 9, followed by histogram, MACD and signal values in their component colors. With a crosshair, it shows values at the selected timestamp. Otherwise it shows the latest values. An em dash means that a component has no value yet, for example during warm-up.
Complete example
This chart uses the default 12/26/9 periods and gives MACD its own pane. The 80 sample candles allow all three components to appear after warm-up. Replace them with your history and update the main series as new data arrives.
import { useEffect } from 'react';
import {
  TradingCharts,
  TradingChartsView,
  type OhlcCandle,
  type ChartPaneOptions,
} from 'react-native-trading-charts';

// Deterministic sample data. Replace this with your market-data feed.
const history: OhlcCandle[] = Array.from({ length: 80 }, (_, index) => {
  const open = 100 + Math.sin(index / 5) * 8;
  const close = 100 + Math.sin((index + 1) / 5) * 8;
  return {
    timestamp: 1_720_000_000_000 + index * 60_000,
    open,
    high: Math.max(open, close) + 2,
    low: Math.min(open, close) - 2,
    close,
    volume: 10 + index,
  };
});

const chartId = 'macd';
const panes: ChartPaneOptions[] = [
  {
    paneId: 'main',
    heightWeight: 3,
    priceScale: { priceScaleId: 'main' },
  },
  {
    paneId: 'macd',
    heightWeight: 1,
    minHeight: 96,
    priceScale: {
      priceScaleId: 'macd',
      valueFormat: {
        type: 'price',
        precision: 4,
        minMove: 0.0001,
        useGrouping: false,
      },
    },
  },
];

export function Example() {
  useEffect(() => {
    TradingCharts.setHistory(chartId, history);
  }, []);

  return (
    <TradingChartsView
      style={{ height: 480 }}
      chartId={chartId}
      panes={panes}
      panesResizable
      additionalSeries={[
        {
          seriesId: 'macd',
          type: 'macd',
          paneId: 'macd',
          priceScaleId: 'macd',
          source: {
            type: 'ohlcvMacd',
            seriesId: 'main',
            fastPeriod: 12,
            slowPeriod: 26,
            signalPeriod: 9,
            valueSource: 'close',
          },
          appearance: {
            macdLine: { width: 1.5, color: '#2E90F5' },
            signalLine: { width: 1.5, color: '#E5B84B' },
            histogram: {
              positiveIncreasingColor: '#38D98A',
              positiveDecreasingColor: '#38D98A80',
              negativeIncreasingColor: '#FF3B6480',
              negativeDecreasingColor: '#FF3B64',
            },
            textColor: '#9791A5',
            zeroLineColor: '#9791A566',
          },
        },
      ]}
    />
  );
}
Configuration reference
All indicators also require seriesId, paneId, priceScaleId; visible defaults to true.
| Option | Values | Default |
|---|---|---|
source.type | 'ohlcvMacd' | Required |
source.seriesId | OHLC source ID | Required |
source.fastPeriod / slowPeriod / signalPeriod | Integers 1…4294967295; fast < slow | 12 / 26 / 9 |
source.valueSource | open, high, low, close | close |
appearance | MacdSeriesAppearance | Optional component styles |
gapThresholdMs | Positive milliseconds | Unset |
See Types for every appearance field and Additional series for shared identifiers.
Appearance defaults
Both macdLine and signalLine accept width, color, style and optional gradient: { topColor, bottomColor }. Width and style inherit the chart's line appearance. MACD color inherits the chart's line color; signal color defaults to theme.axisTextColor. textColor falls back to Y-axis text and zeroLineColor to theme.gridColor.
The histogram's default colors are theme.upColor for positive increasing values, the same color with 80 alpha for positive decreasing values, theme.downColor with 80 alpha for negative increasing values, and theme.downColor for negative decreasing values. Set each property under appearance.histogram to override it.