RSI
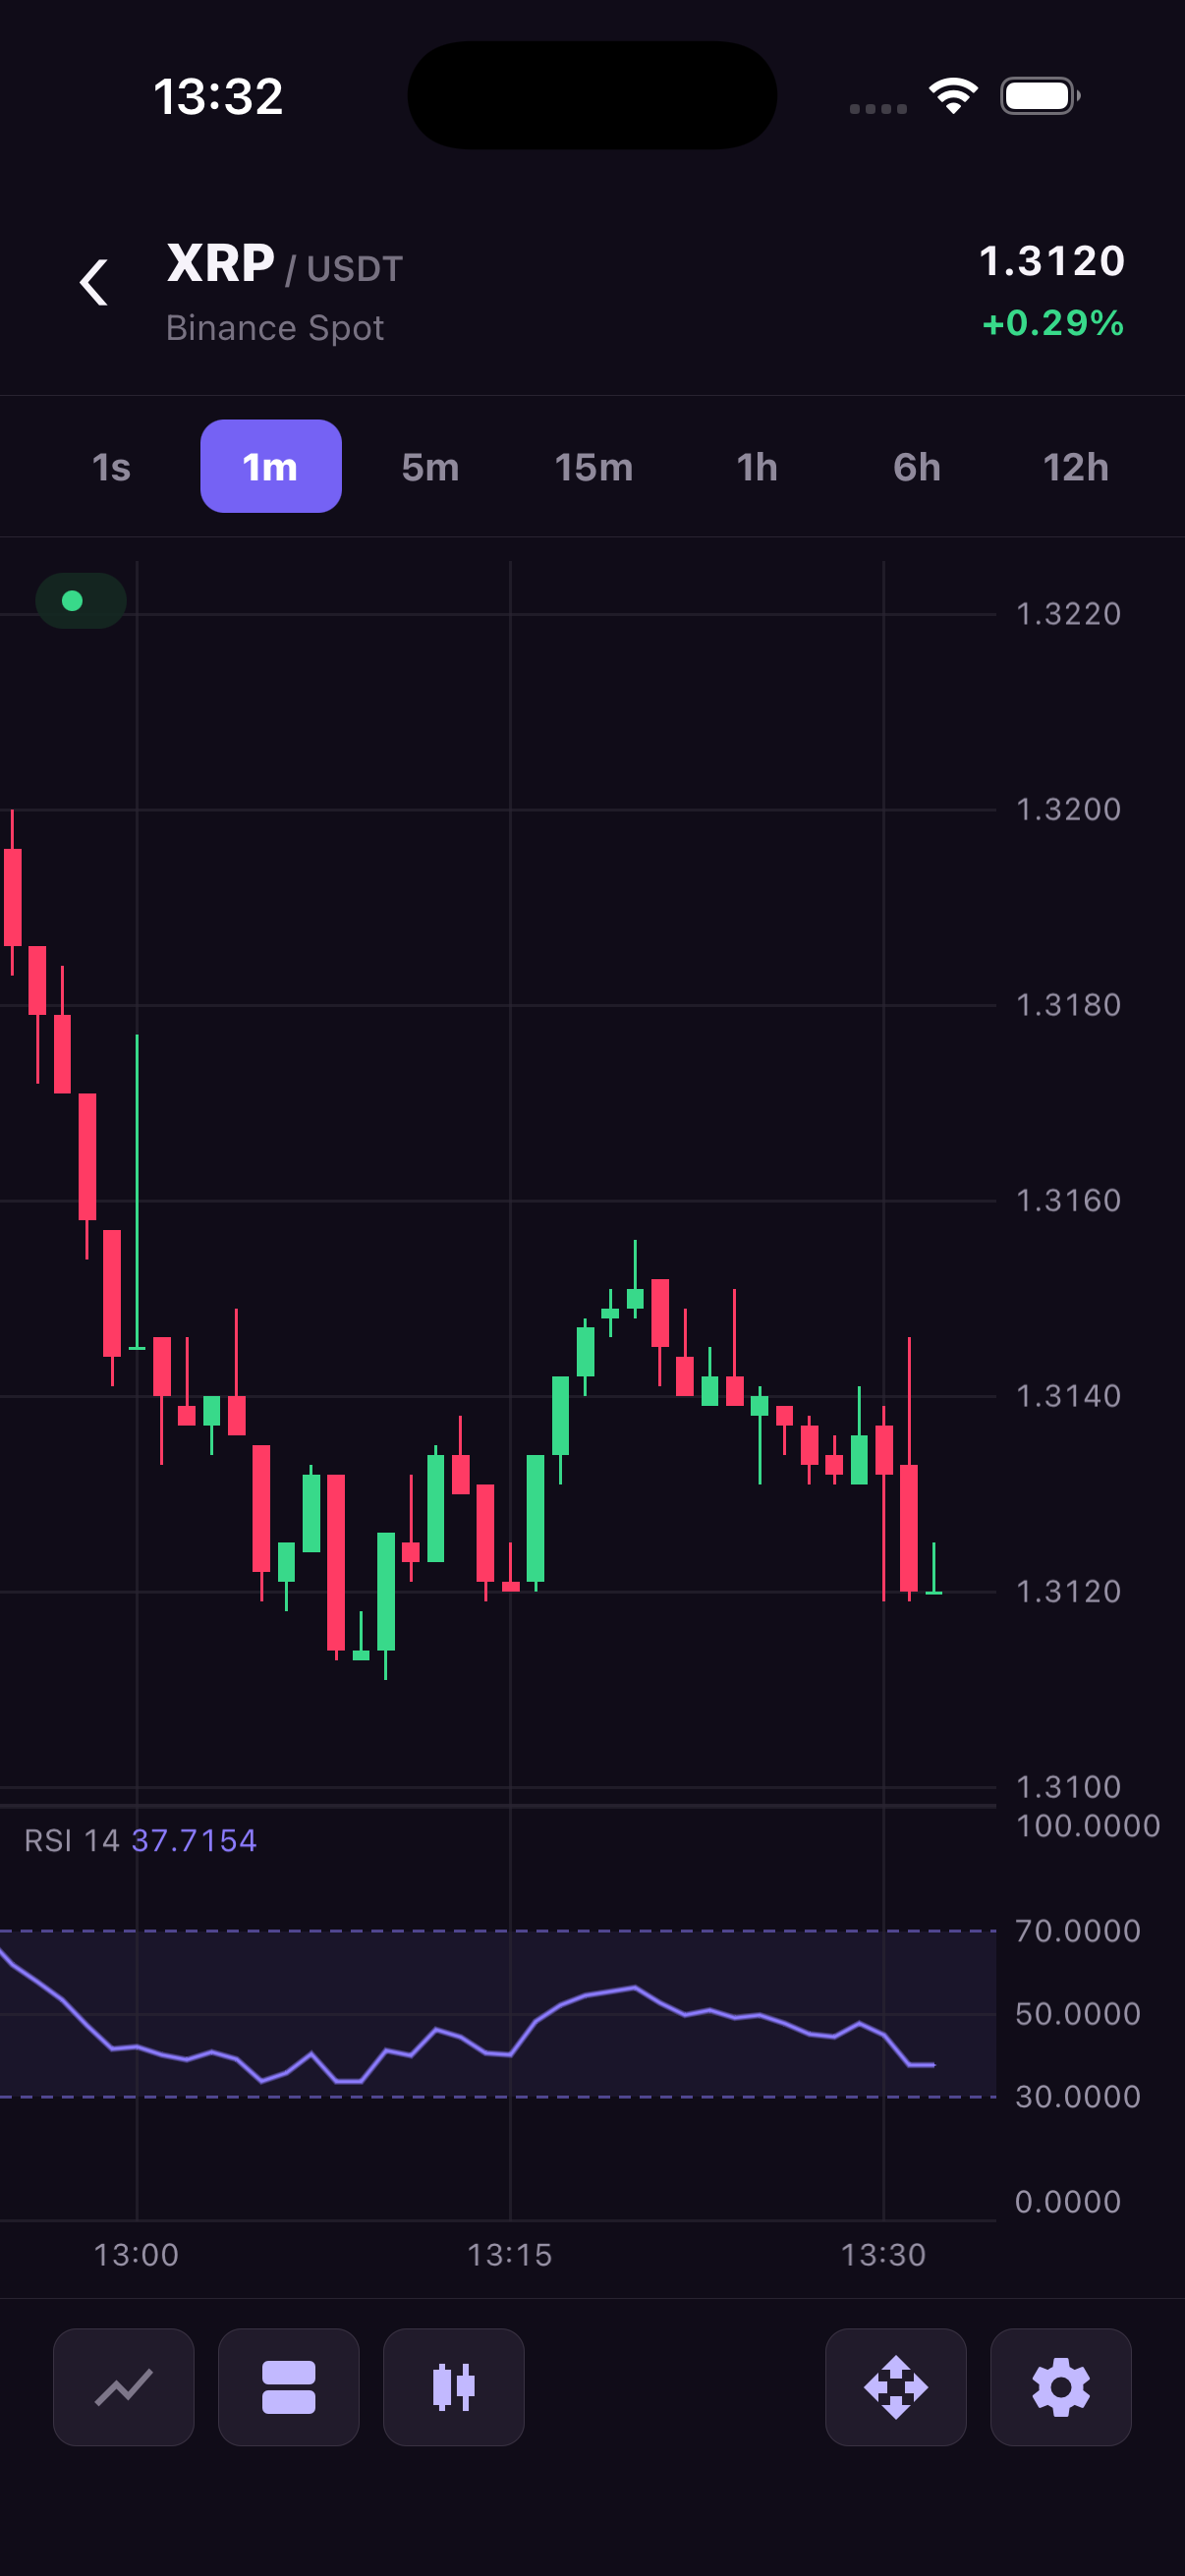
The Relative Strength Index (RSI) compares recent gains and losses in closing prices and expresses the result on a scale of 0 to 100. Put it below the price chart when users need to inspect this value alongside the candles without sharing the price axis.
The library calculates RSI from an OHLC source using Wilder smoothing. You provide the source and optional period; new source candles and trades update the indicator automatically. RSI must use a pane separate from main because its fixed range has different units from price.
Values, levels and warm-up
The default period is 14. RSI needs period + 1 candles before it can show its first value. The horizontal reference levels default to 30 and 70; change levels.oversold and levels.overbought to move them. The pane keeps its range at 0 to 100 and ignores vertical scale gestures.
The pane header shows the RSI value at the selected candle, or the latest value when there is no crosshair. It displays an em dash when there is not enough history or no value matches the selected timestamp. Multiple RSI series can share a pane, with one header row per visible series. A source must contain OHLC data; derived indicators cannot serve as RSI sources.
Use width and color for the curve, textColor for the RSI <period> header, levelLineColor for the dashed reference levels, and bandColor for the area between them. The value in the header uses the curve color. When you omit textColor, the title uses the Y-axis text color, as the MACD title does.
Complete example
The component below places a 14-period RSI under the main chart, with reference levels at 30 and 70. It loads 80 sample candles, enough to show RSI after its initial 15-candle warm-up. Later updates to the main candles also update RSI.
import { useEffect } from 'react';
import {
  TradingCharts,
  TradingChartsView,
  type OhlcCandle,
  type ChartPaneOptions,
} from 'react-native-trading-charts';

// Deterministic sample data. Replace this with your market-data feed.
const history: OhlcCandle[] = Array.from({ length: 80 }, (_, index) => {
  const open = 100 + Math.sin(index / 5) * 8;
  const close = 100 + Math.sin((index + 1) / 5) * 8;
  return {
    timestamp: 1_720_000_000_000 + index * 60_000,
    open,
    high: Math.max(open, close) + 2,
    low: Math.min(open, close) - 2,
    close,
    volume: 10 + index,
  };
});

const chartId = 'rsi';
const panes: ChartPaneOptions[] = [
  {
    paneId: 'main',
    heightWeight: 3,
    priceScale: { priceScaleId: 'main' },
  },
  {
    paneId: 'rsi',
    heightWeight: 1,
    minHeight: 96,
    priceScale: {
      priceScaleId: 'rsi',
      valueFormat: {
        type: 'price',
        precision: 4,
        minMove: 0.0001,
        useGrouping: false,
      },
    },
  },
];

export function Example() {
  useEffect(() => {
    TradingCharts.setHistory(chartId, history);
  }, []);

  return (
    <TradingChartsView
      style={{ height: 480 }}
      chartId={chartId}
      panes={panes}
      additionalSeries={[
        {
          seriesId: 'rsi',
          type: 'line',
          paneId: 'rsi',
          priceScaleId: 'rsi',
          source: { type: 'ohlcvRsi', seriesId: 'main', period: 14 },
          levels: { oversold: 30, overbought: 70 },
          appearance: {
            width: 1.5,
            color: '#6C8CFF',
            textColor: '#9791A5',
            levelLineColor: '#6C8CFF80',
            bandColor: '#6C8CFF14',
          },
        },
      ]}
    />
  );
}
Configuration reference
All indicators also require seriesId, paneId, priceScaleId; visible defaults to true.
| Option | Values | Default |
|---|---|---|
source.type | 'ohlcvRsi' | Required |
source.seriesId | OHLC source ID | Required |
source.period | Positive integer | 14 |
levels.oversold / overbought | 0 <= oversold < overbought <= 100 | 30 / 70 |
appearance | RsiSeriesAppearance | Line style plus title, band and level colors |
gapThresholdMs | Positive milliseconds | Unset |
See Types for every appearance field and Additional series for shared identifiers.
Appearance defaults
width, color and style inherit the chart's line appearance. gradient is optional and takes { topColor, bottomColor }; both colors must be valid hex colors. textColor falls back to Y-axis text. levelLineColor defaults to the curve color with 80 alpha, and bandColor to the curve color with 14 alpha. Width must be positive; all colors accept #RRGGBB or #RRGGBBAA.