Axes & formatting
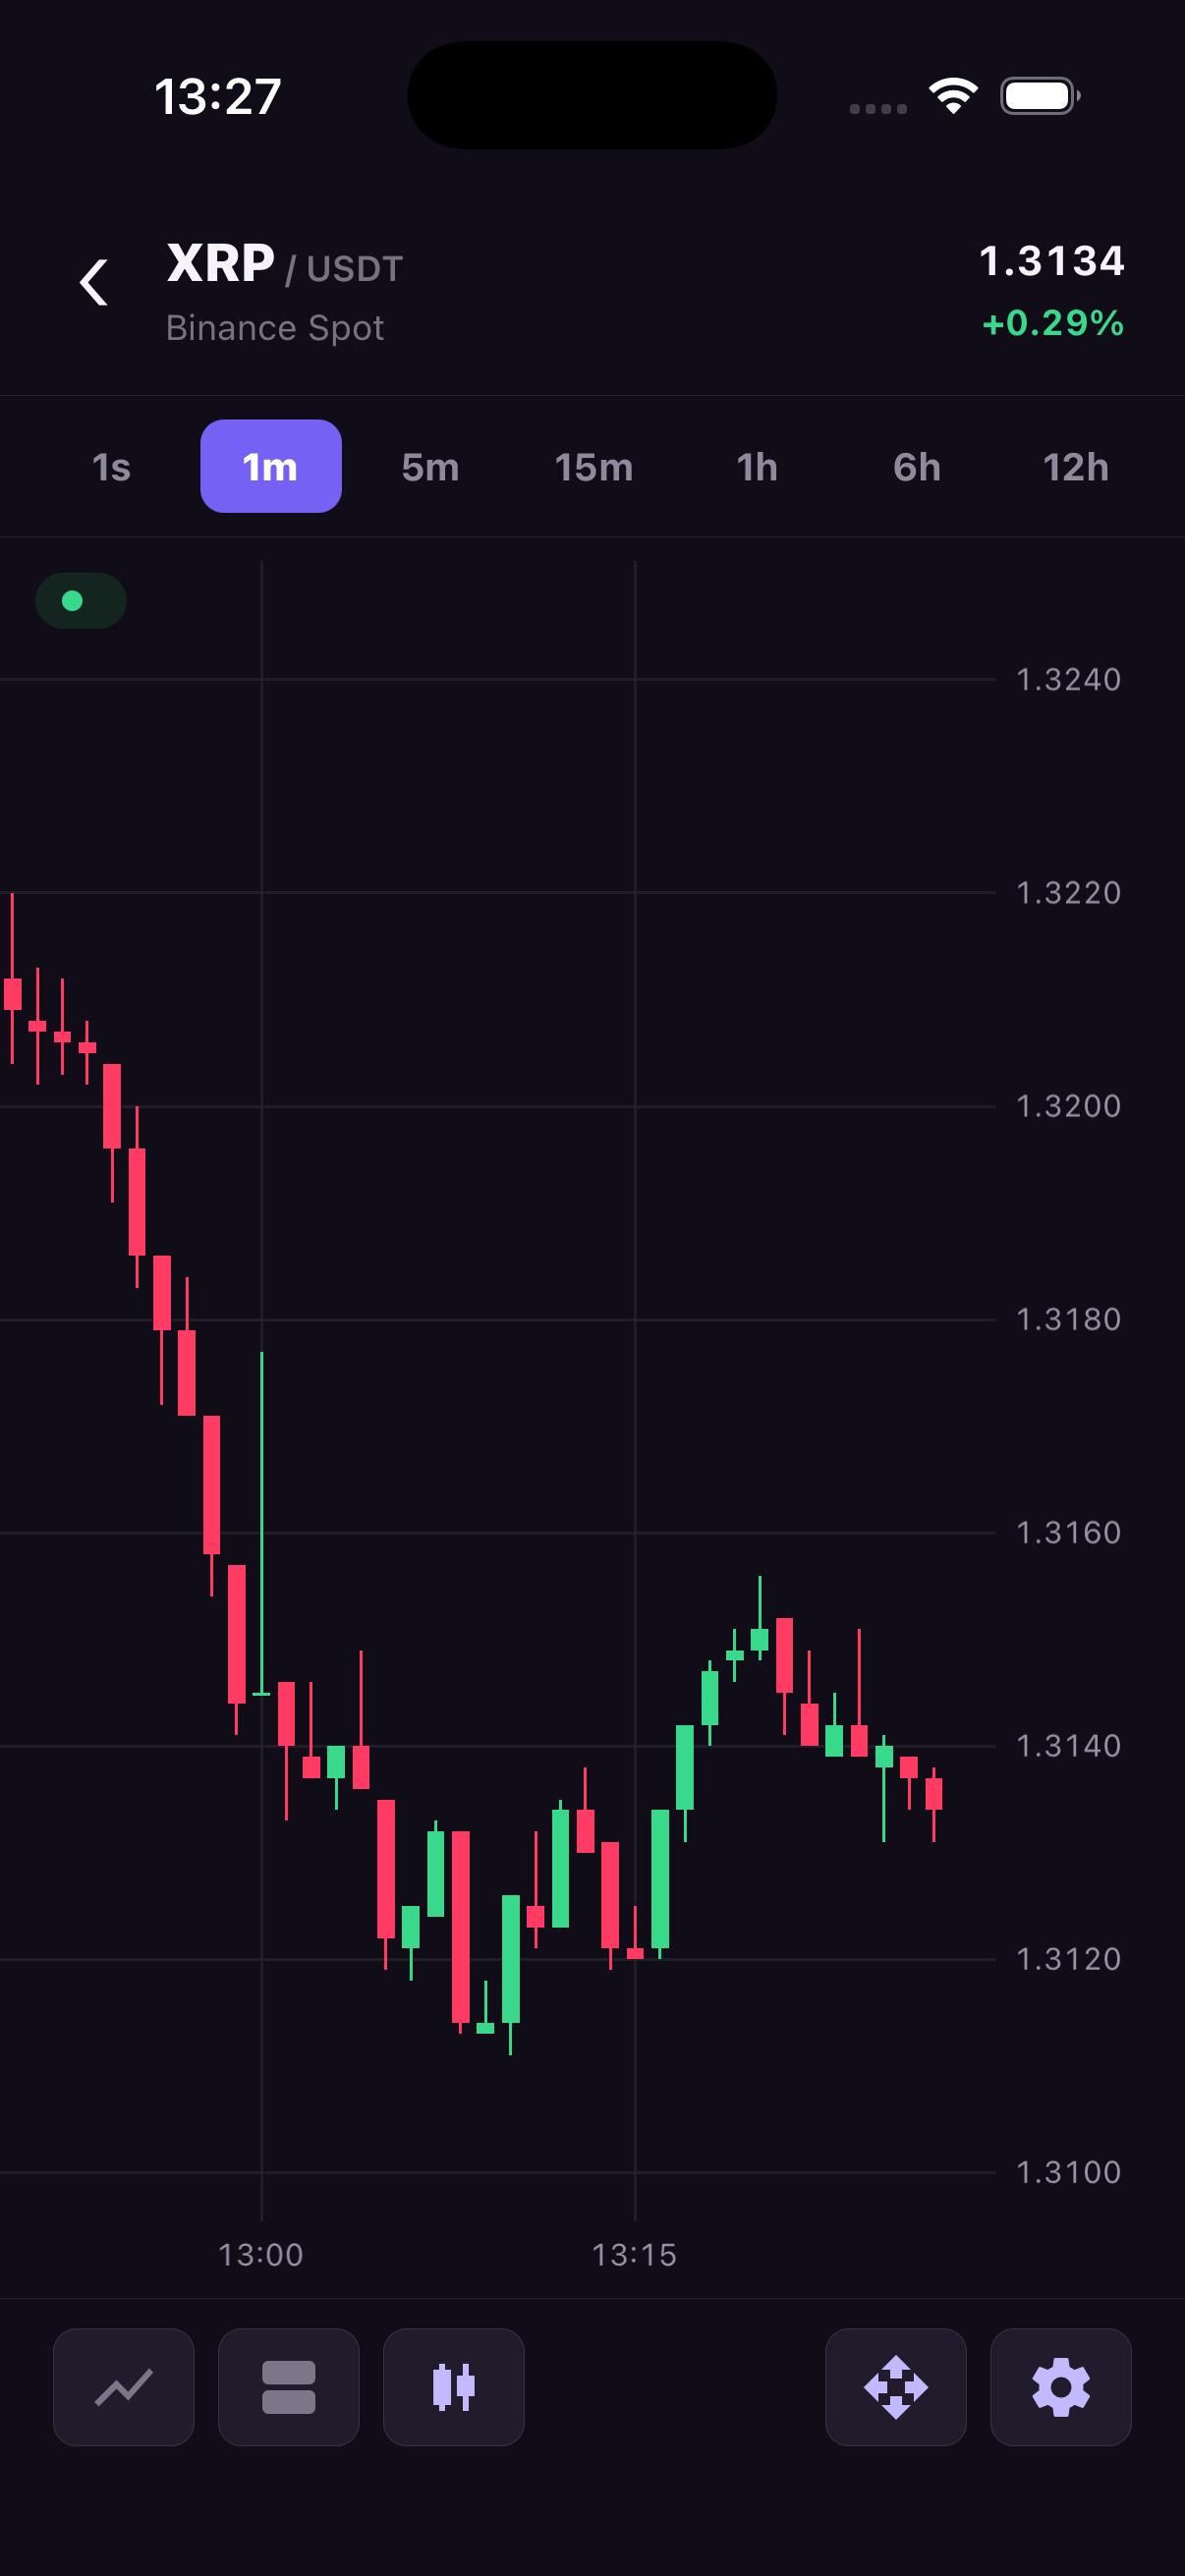
The axes tell users when a value occurred and how large it was. The X axis represents time; the Y axis shows prices or the values in an indicator pane. Their labels need to suit the data: a price may need two decimals, a small token price more precision, and volume a compact number.
Use xAxis and yAxis for spacing, dimensions and scale behavior. Use formatters when labels in different places need different formats. For example, the axis can show a short price while the tooltip shows more decimals for inspection.
Formatting changes the displayed text. It does not change the stored timestamps or prices. The time zone used to group trades into candles is configured separately under Time & trade aggregation.
X axis
Use elapsed-time spacing when gaps between timestamps should occupy space. Use logical spacing when each candle should have the same horizontal slot, for example across a market closure. Both modes keep timestamps in the labels.
| Property | Type / values | Default | Description |
|---|---|---|---|
visible | boolean | true | Shows the time axis. |
height | Positive number | 26 | Axis height in native view units. |
locale | Locale string | 'en-GB' | Legacy/default date locale. |
timeZone | IANA time-zone string | 'UTC' | Legacy/default label time zone. |
showSeconds | boolean | false | Enables second-level axis labels. |
spacing | 'time', 'logical' | 'time' | Uses elapsed milliseconds or uniform candle-index slots. |
Y axis
The price axis is always placed on the right side of the chart.
| Property | Type / values | Default | Description |
|---|---|---|---|
visible | boolean | true | Shows the main price axis. |
width | Positive number | 64 | Axis width in native view units. |
defaultScale | Number from 0.1 to 10 | 1 | Baseline vertical scale restored by history loads and fitContent. |
scaleMargins.top | Non-negative fraction | 0.2 | Reserved space above visible values. |
scaleMargins.bottom | Non-negative fraction | 0.1 | Reserved space below visible values. |
valueFormat | YAxisValueFormat | Price format | Legacy/main Y-axis formatter; formatters.price.yAxis wins. |
Scale margins must leave at least 1e-6 of the plot area, so their sum must be at most 1 - 1e-6. When visible values are equal, autoscale expands the range using minMove.
Price formats
Choose price for a fixed number of decimal places, compact for large values with suffixes, or significant when meaningful digits matter more than a fixed decimal count. Set minMove to the instrument tick size so scaling and labels use an appropriate minimum price step.
| Property | Type / values | Default | Description |
|---|---|---|---|
type | 'price' | 'price' | Fixed decimal formatting. |
precision | Integer 0...12 | 2 | Decimal precision. |
type | 'compact' | Not applicable | Compact suffix formatting for large values. |
precision | Integer 0...8 | 2 | Compact precision. |
type | 'significant' | Not applicable | Significant digits with compact crypto zero-count notation. |
significantDigits | Integer 1...8 | 3 | Significant digits to display. |
minMove | Positive number | 0.01 | Real instrument tick size; omitted from display-only formats. |
locale | Locale string | 'en-GB' | Native number locale. |
currencySymbol | string | '' | Prefix displayed with prices. |
useGrouping | boolean | true | Enables locale grouping where supported. |
Volume formats use type: 'volume', precision defaulting to 2, locale defaulting to en-GB, and useGrouping defaulting to true.
Role-specific formatters
The axis, tooltip and crosshair badges can show the same value with different precision or date detail. Set the corresponding role under formatters instead of changing every label at once.
| Property | Type / values | Default | Description |
|---|---|---|---|
date.xAxis.locale | Locale string | xAxis.locale | Locale for adaptive X-axis labels. |
date.xAxis.timeZone | IANA time zone | xAxis.timeZone | Time zone for adaptive X-axis labels. |
date.xAxis.seconds | ICU pattern | 'HH:mm:ss' | Second-span label format. |
date.xAxis.time | ICU pattern | 'HH:mm' | Intraday label format. |
date.xAxis.day | ICU pattern | 'd MMM' | Day label format. |
date.xAxis.month | ICU pattern | 'MMM yyyy' | Month label format. |
date.xAxis.year | ICU pattern | 'yyyy' | Year label format. |
date.crosshairTimeBadge | { pattern, locale?, timeZone? } | 'd MMM yyyy HH:mm:ss' | Crosshair time badge format. |
date.tooltipHeader | { pattern, locale?, timeZone? } | 'd MMM yyyy HH:mm:ss' | Tooltip header format. |
price.yAxis | YAxisValueFormat | yAxis.valueFormat | Main Y-axis format. |
price.priceExtremes | PriceDisplayFormat | Main Y format | Visible high/low format. |
price.currentPrice | PriceDisplayFormat | Main Y format | Current-price format. |
price.crosshairPrice | PriceDisplayFormat | Main Y format | Crosshair price badge format. |
price.tooltip | PriceDisplayFormat | Main Y format | Tooltip OHLC value format. |
Date patterns use Unicode/ICU syntax. Role-specific formatters override the legacy xAxis and yAxis.valueFormat values.
Format each role
This chart uses uniform candle spacing, a two-decimal price axis, and more precision in the tooltip. Dates remain timestamps in milliseconds even with logical spacing.
import { useEffect } from 'react';
import {
  TradingCharts,
  TradingChartsView,
  type OhlcCandle,
} from 'react-native-trading-charts';

// Deterministic sample data. Replace this with your market-data feed.
const history: OhlcCandle[] = Array.from({ length: 80 }, (_, index) => {
  const open = 100 + Math.sin(index / 5) * 8;
  const close = 100 + Math.sin((index + 1) / 5) * 8;
  return {
    timestamp: 1_720_000_000_000 + index * 60_000,
    open,
    high: Math.max(open, close) + 2,
    low: Math.min(open, close) - 2,
    close,
    volume: 10 + index,
  };
});

const chartId = 'axes';

export function Example() {
  useEffect(() => {
    TradingCharts.setHistory(chartId, history);
  }, []);

  return (
    <TradingChartsView
      style={{ height: 420 }}
      chartId={chartId}
      xAxis={{ spacing: 'logical', height: 30, timeZone: 'UTC' }}
      yAxis={{
        width: 88,
        scaleMargins: { top: 0.2, bottom: 0.1 },
        valueFormat: {
          type: 'price',
          precision: 2,
          minMove: 0.01,
          currencySymbol: '$',
        },
      }}
      formatters={{
        date: {
          xAxis: { time: 'HH:mm', day: 'd MMM', timeZone: 'UTC' },
          crosshairTimeBadge: { pattern: 'd MMM HH:mm', timeZone: 'UTC' },
        },
        price: {
          tooltip: { type: 'price', precision: 4, currencySymbol: '$' },
        },
      }}
      appearance={{
        xAxis: { text: { fontSize: 11 } },
        yAxis: { text: { fontSize: 12 } },
      }}
    />
  );
}
minMove sets the instrument tick size used by the scale. Formats used only to display values do not include this property. CompactValueFormat on an axis does not expose useGrouping; fixed-price, significant and volume formats do. The display-only compact variant also accepts useGrouping.