Parabolic SAR
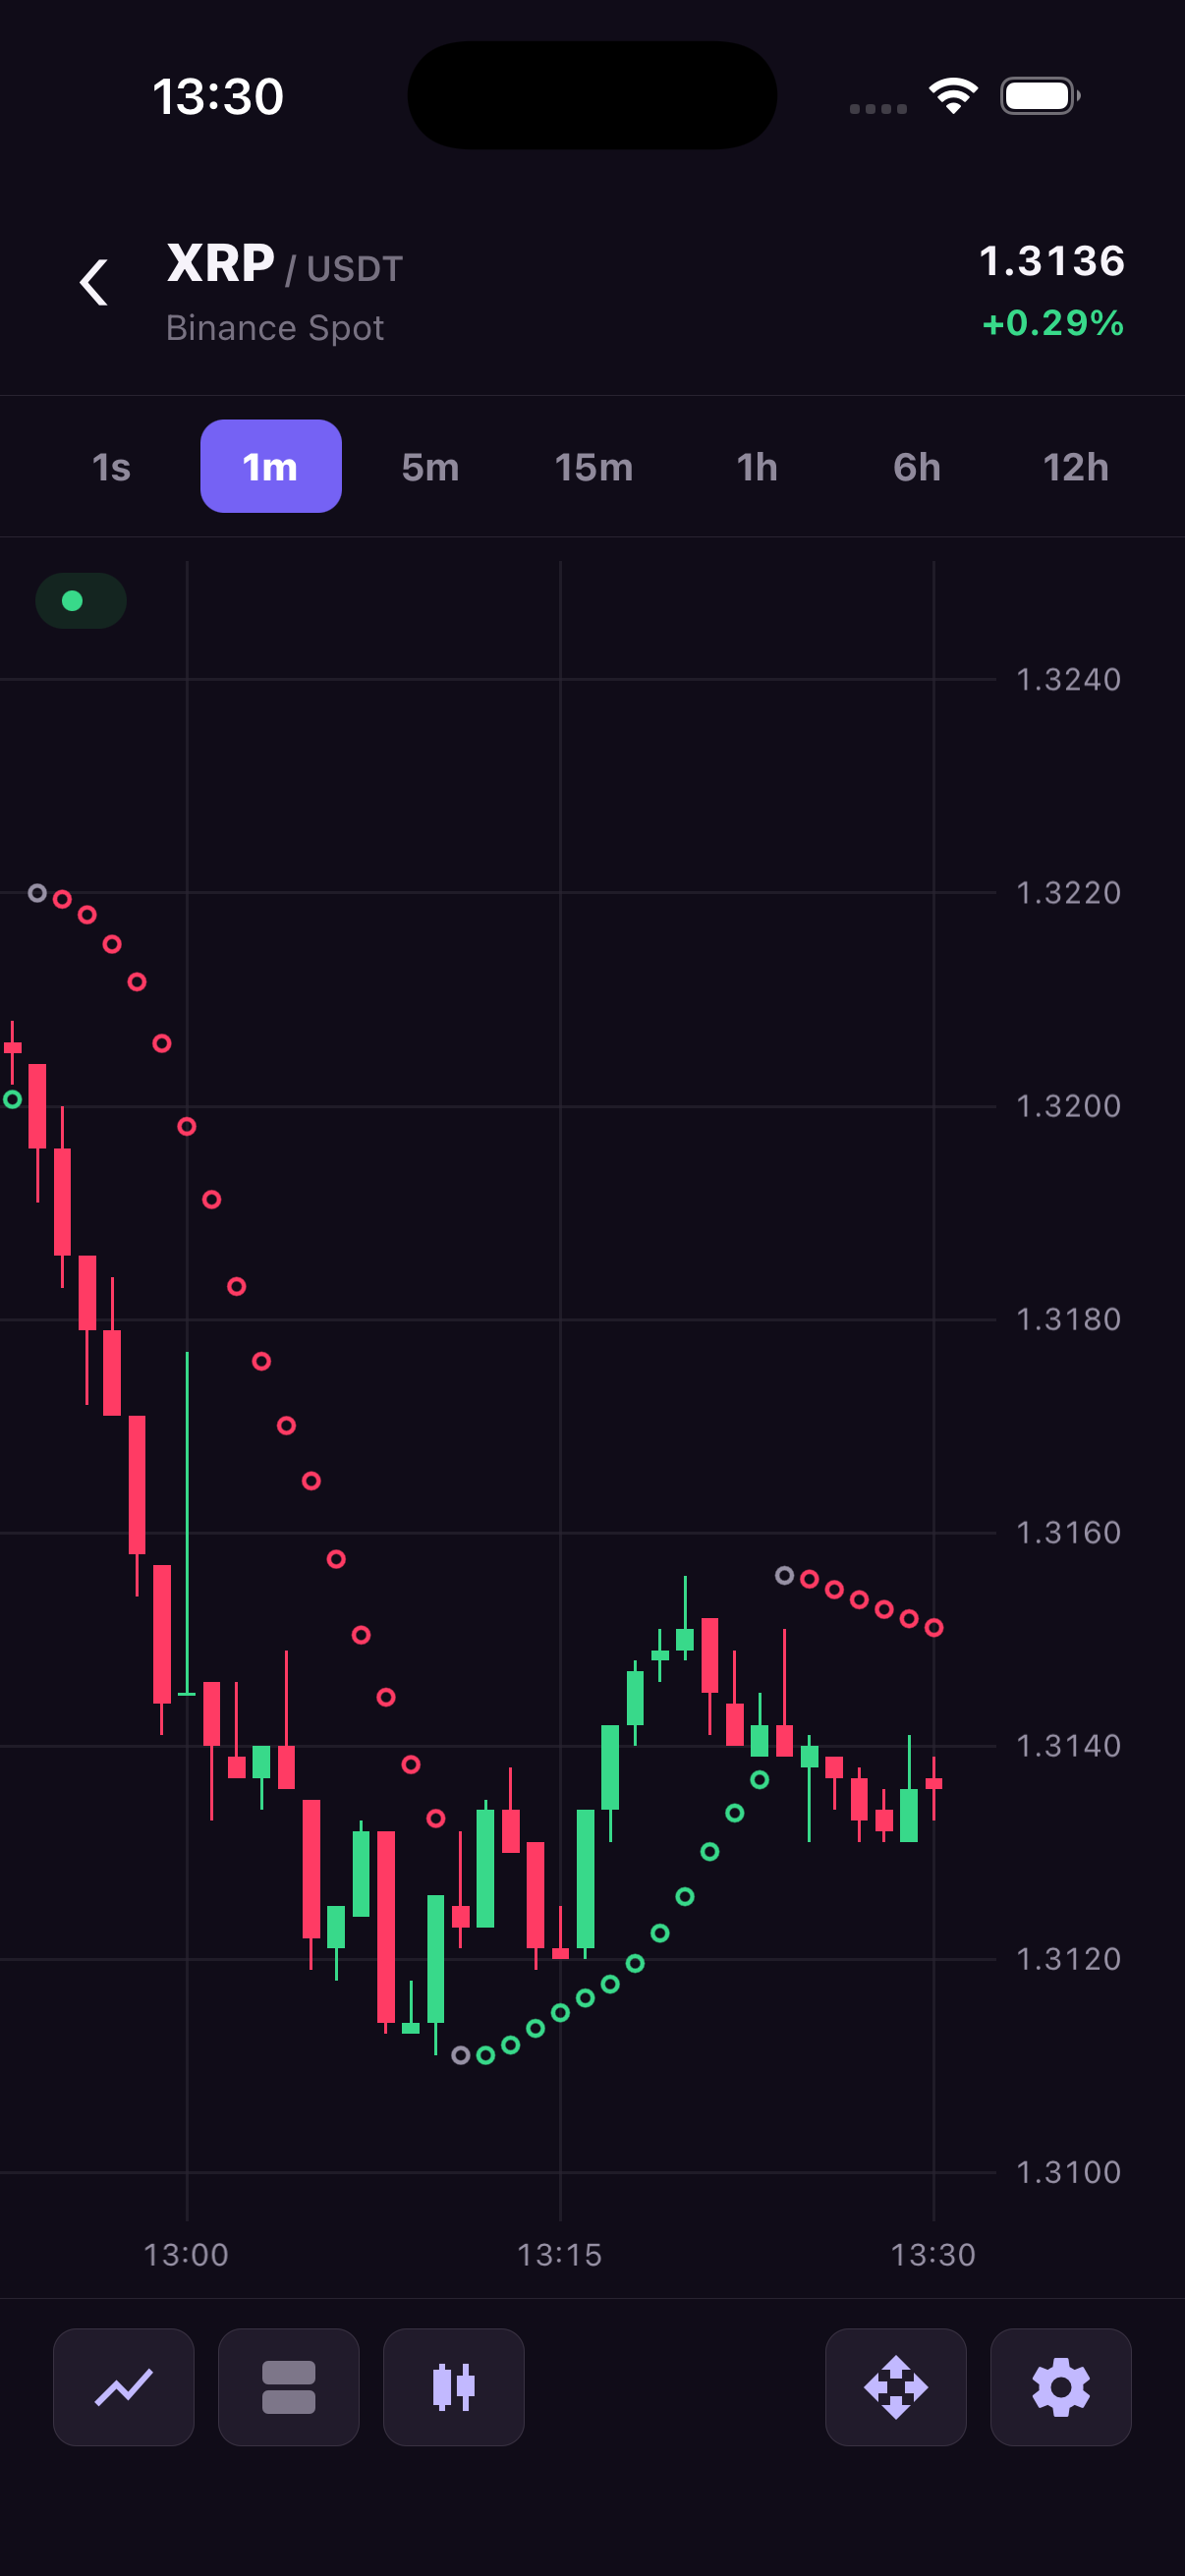
SAR draws hollow circles over the source price pane. The shared C++ engine calculates values from high/low prices, following TA-Lib SAR, including its two-candle initialization and reversal rules. The first candle has no value. The initial acceleration equals step; each new trend extreme increases it by step, up to maximum.
import { TradingChartsView, TradingCharts, type SarSeriesOptions } from 'react-native-trading-charts';

const sar: SarSeriesOptions = {
  seriesId: 'sar',
  type: 'sar',
  paneId: 'main',
  priceScaleId: 'main',
  source: {
    type: 'ohlcvSar',
    seriesId: 'main',
    step: 0.02,
    maximum: 0.20,
  },
  appearance: {
    upColor: '#38D98A',
    downColor: '#FF3B64',
    reversalColor: '#9791A5',
  },
};

<TradingChartsView chartId="prices" additionalSeries={[sar]} />;

// Alternatively, add imperatively; do not register the same ID twice.
TradingCharts.addSeries('prices', sar);| Option | Meaning | Default |
|---|---|---|
source.step | Initial acceleration and increment | 0.02 |
source.maximum | Acceleration limit | 0.20 |
visible | Whether to render the indicator | true |
appearance.upColor | Rising trend | #38D98A |
appearance.downColor | Falling trend | #FF3B64 |
appearance.reversalColor | First point after a reversal | #9791A5 |
Parameters must be finite and satisfy 0 < step <= maximum <= 1. Colors accept HEX with optional alpha (#RRGGBBAA). A reversal changes exactly one point to the reversal color; the first calculated point uses its trend color. Scrolling does not recolor the first visible point.
The source must be main or a data-backed OHLC series on the same pane and price scale. SAR can coexist with SMA, EMA and BOLL. It uses the underlying high/low values even when the source is displayed as a line or area. It cannot be fed with setSeriesData or used as the main chart type.
Circles have a 6 point/dp diameter and 1 point/dp stroke, with antialiased edges. Visible SAR values participate in autoscale. There are no connecting lines or text legend. Missing time buckets are not synthesized, and gaps do not restart the calculation. History prepends can change later values because they change the initialization; live candle/trade updates recalculate only the affected tail.
Crosshair values
onSelectedCandleChange includes a scalar entry with seriesType: 'sar', sourceType: 'ohlcvSar', and value. The value is null for the first source candle or a selected timestamp without a matching source value. Hidden SAR series are omitted.
<TradingChartsView
  chartId="prices"
  additionalSeries={[sar]}
  onSelectedCandleChange={(_candle, seriesValues) => {
    const selected = seriesValues.find((value) => value.seriesId === 'sar');
    if (selected?.kind === 'scalar') console.log(selected.value);
  }}
/>
In the example, use Indicators → SAR to toggle it. Chart settings → SAR contains Step, Maximum and the three colors. Numeric changes apply when editing ends; invalid input displays an error and keeps the last valid configuration. Decimal commas are accepted. Restore defaults disables SAR and restores all its settings.