Current price & extremes
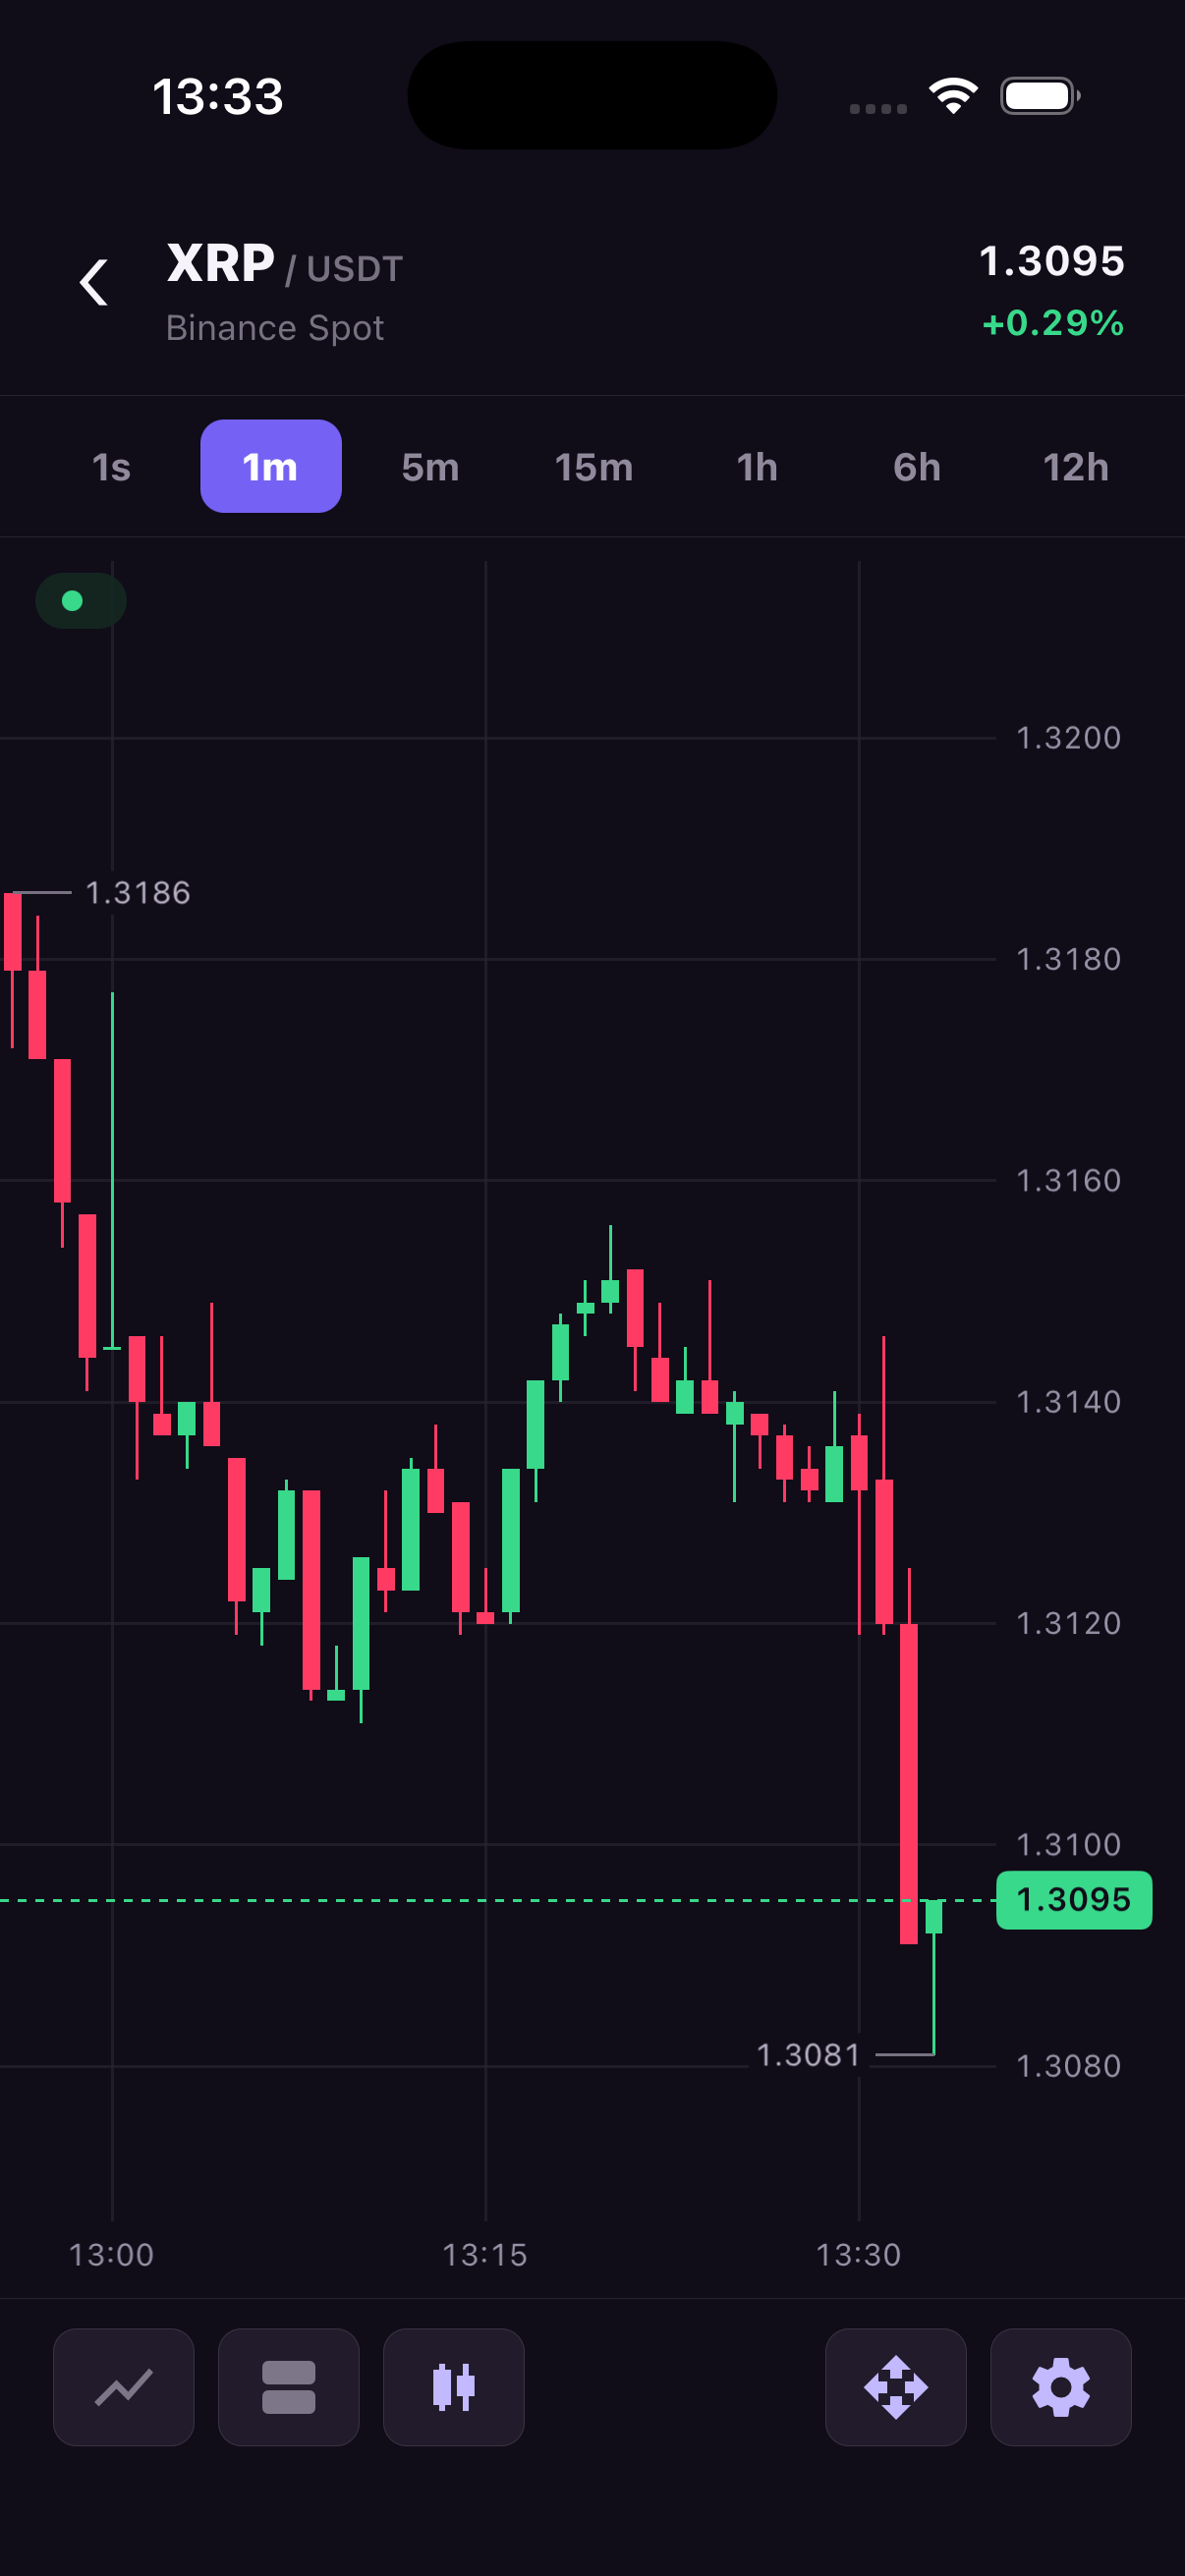
Price overlays label values that are easy to lose track of while panning or zooming. The current-price line and its axis badge show the latest value in the main series. The extrema labels mark the highest and lowest visible values.
Use currentPrice and priceExtremes to choose which labels appear. They follow chart data automatically, so your app does not need to maintain them as custom markers. If you need to label an order price or another value of your own, use custom price markers.
A current-price badge can stay pinned to the nearest edge when its price moves outside the visible vertical range. This keeps the latest value readable while the user inspects another part of the chart.
| Property | Type / values | Default | Description |
|---|---|---|---|
currentPrice.visible | boolean | true | Shows the latest-price line and eligible label. |
currentPrice.showLabel | boolean | true | Shows the Y-axis latest-price badge. |
currentPrice.pinToEdge | boolean | true | Pins an off-screen price label to the nearest Y edge. |
priceExtremes.visible | boolean | true | Labels visible high and low values. |
When a pinned current price is outside the visible Y range, its line is hidden and its label remains at the edge. Set pinToEdge: false to hide the label too. An extremum outside a manually scaled viewport remains hidden.
Style built-in overlays
import { useEffect } from 'react';
import {
  TradingCharts,
  TradingChartsView,
  type OhlcCandle,
} from 'react-native-trading-charts';

// Deterministic sample data. Replace this with your market-data feed.
const history: OhlcCandle[] = Array.from({ length: 80 }, (_, index) => {
  const open = 100 + Math.sin(index / 5) * 8;
  const close = 100 + Math.sin((index + 1) / 5) * 8;
  return {
    timestamp: 1_720_000_000_000 + index * 60_000,
    open,
    high: Math.max(open, close) + 2,
    low: Math.min(open, close) - 2,
    close,
    volume: 10 + index,
  };
});

const chartId = 'price-overlays';

export function Example() {
  useEffect(() => {
    TradingCharts.setHistory(chartId, history);
  }, []);

  return (
    <TradingChartsView
      style={{ height: 420 }}
      chartId={chartId}
      currentPrice={{ visible: true, showLabel: true, pinToEdge: true }}
      priceExtremes={{ visible: true }}
      appearance={{
        currentPrice: {
          line: { upColor: '#009E73', downColor: '#E64966' },
          label: { text: { color: '#FFFFFF' }, border: { radius: 6 } },
        },
        priceExtremes: {
          text: { color: '#94A3B8', fontSize: 11 },
          connectorColor: '#64748B',
        },
      }}
    />
  );
}
The current price uses the active main series value source. Line and area charts use the configured OHLC field. Label text is formatted with formatters.price.currentPrice and formatters.price.priceExtremes.