SMA & EMA
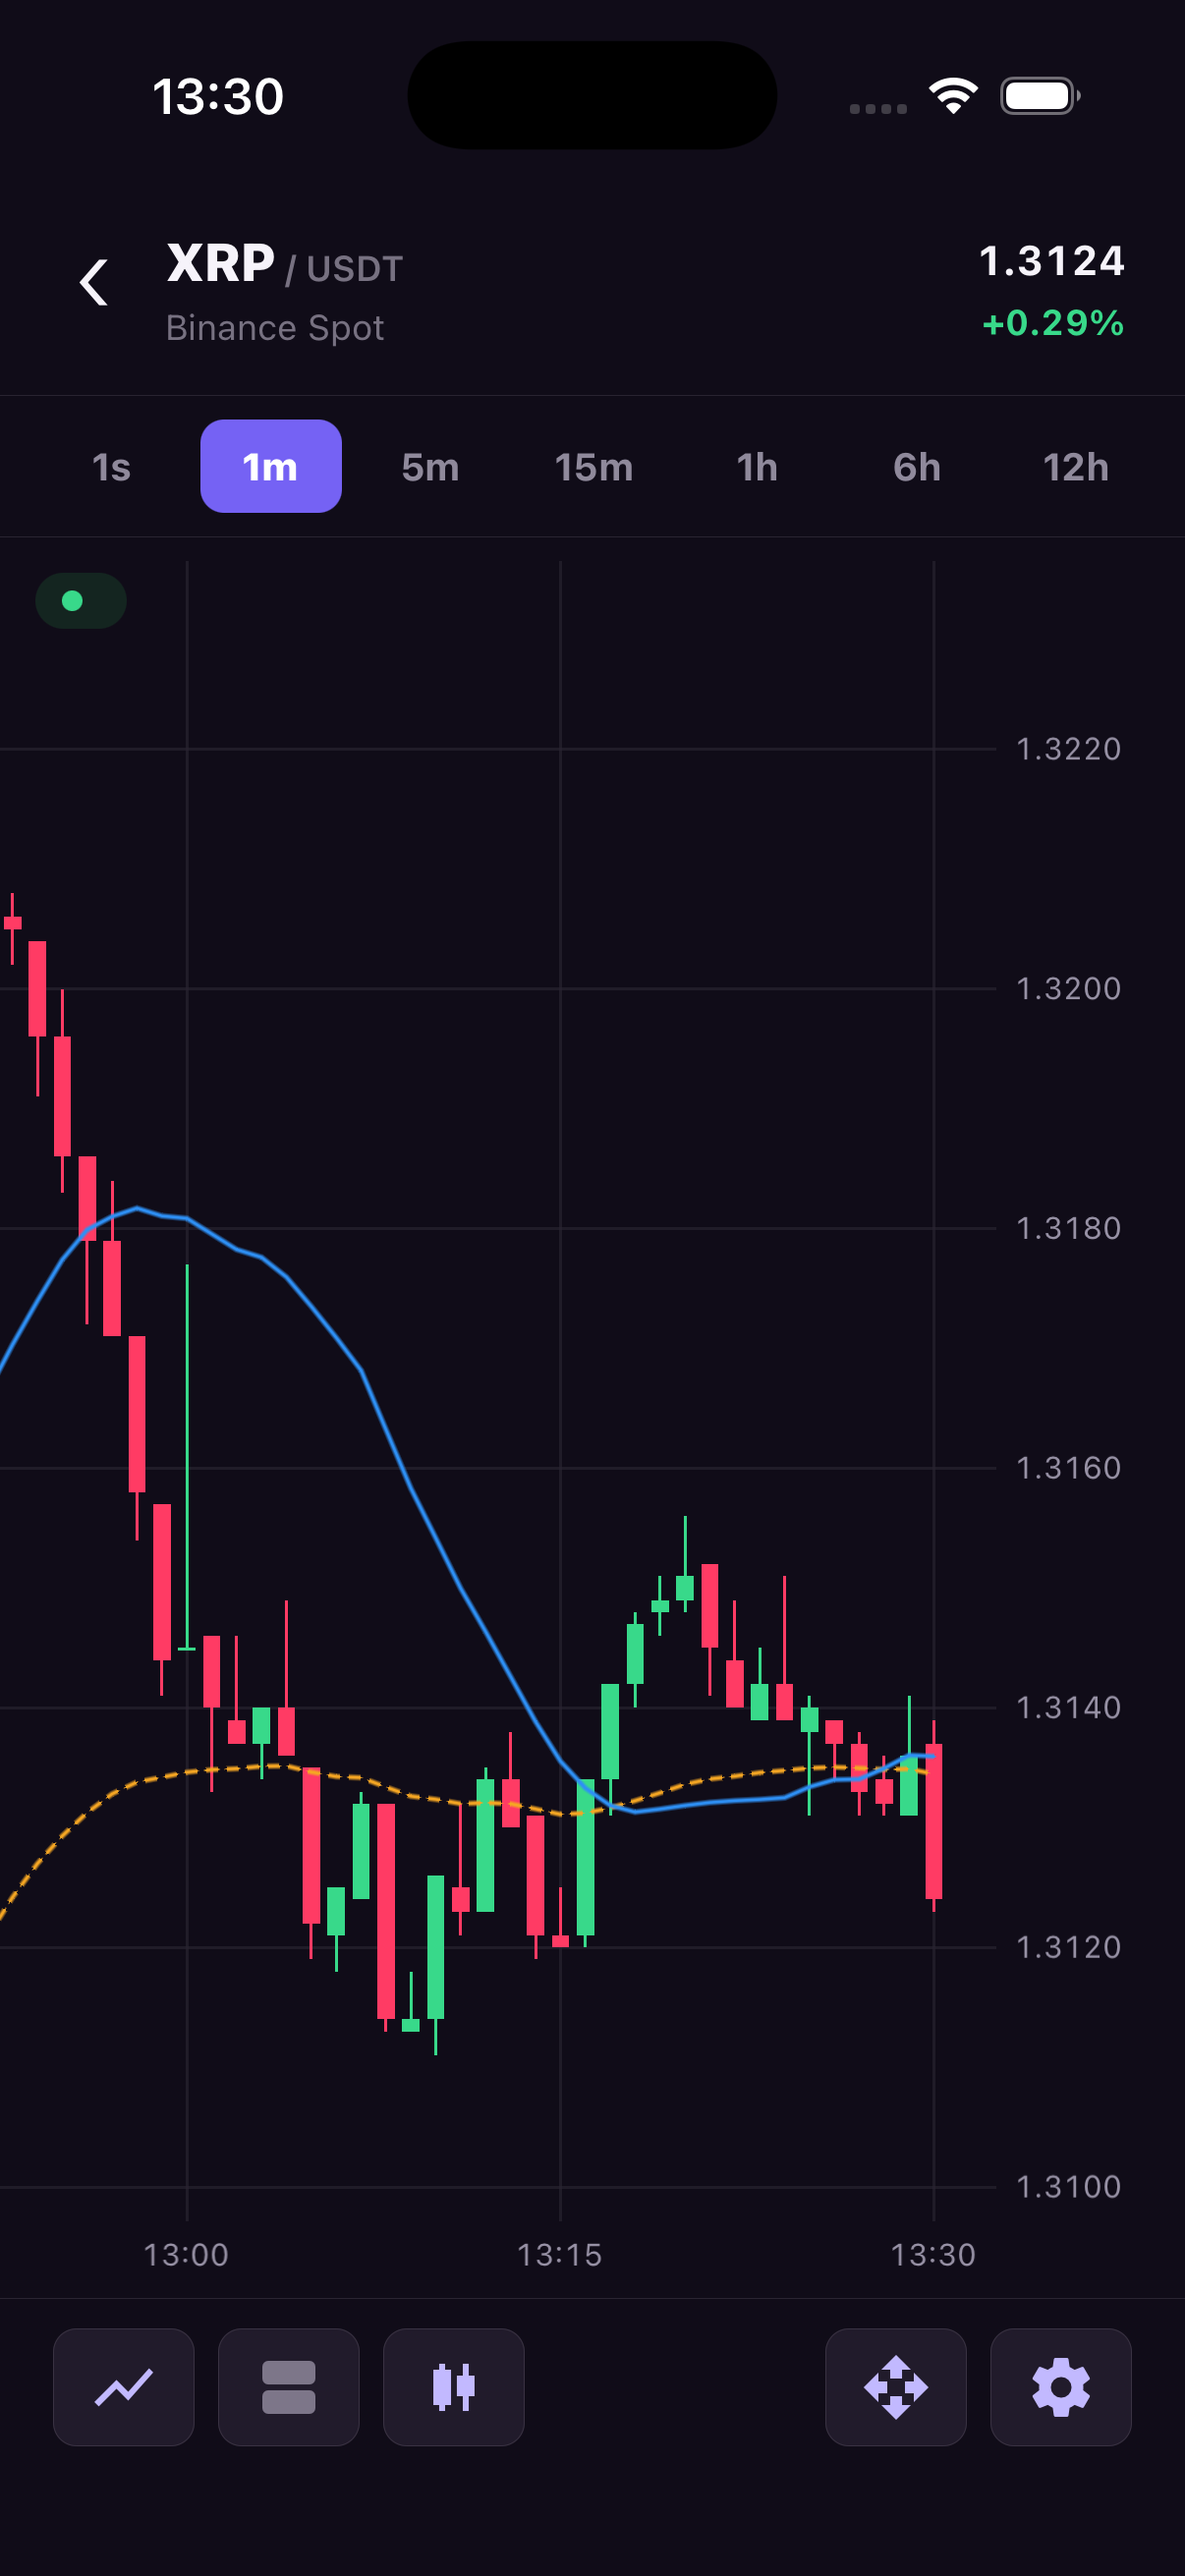
A moving average turns recent prices into a smoother line. For example, a 20-period SMA on a one-minute chart averages the last 20 candles at each point. Overlay it on the candles when users need to compare individual price moves with the recent average.
A simple moving average (SMA) gives every price in that window equal weight. An exponential moving average (EMA) gives more weight to recent prices, so it responds differently to new data. Both appear as additional line series and default to using closing prices.
Choose a source series and a period. The shared C++ engine calculates the values and updates them as history, candles or trades change. Both indicators use the same content vertex buffer and GPU draw call as other price series.
Calculation and source requirements
period is required and must be an integer from 1 through 4294967295. valueSource accepts open, high, low, or close and defaults to close. The first value appears at candle index period - 1: SMA is the mean of that window, while EMA starts with the same SMA and then applies alpha = 2 / (period + 1). The series stays empty until enough candles arrive.
Moving averages must use the same paneId and priceScaleId as their source. The source can be main or another series with its own OHLC data. An indicator cannot use another derived indicator as its source. gapThresholdMs splits the drawn line across large time gaps without restarting the calculation. Each line accepts width, color, an optional vertical gradient, and style: 'solid' | 'dashed'. Dashed strokes use a density-aware 4/3 dash-gap pattern on both platforms.
Complete example
This example overlays a blue SMA with period 20 and a dashed orange EMA with period 50. Its 80 sample candles let both lines finish warming up. Replace the history with your feed; updates to the source candles recalculate both averages.
import { useEffect } from 'react';
import {
  TradingCharts,
  TradingChartsView,
  type OhlcCandle,
} from 'react-native-trading-charts';

// Deterministic sample data. Replace this with your market-data feed.
const history: OhlcCandle[] = Array.from({ length: 80 }, (_, index) => {
  const open = 100 + Math.sin(index / 5) * 8;
  const close = 100 + Math.sin((index + 1) / 5) * 8;
  return {
    timestamp: 1_720_000_000_000 + index * 60_000,
    open,
    high: Math.max(open, close) + 2,
    low: Math.min(open, close) - 2,
    close,
    volume: 10 + index,
  };
});

const chartId = 'moving-averages';

export function Example() {
  useEffect(() => {
    TradingCharts.setHistory(chartId, history);
  }, []);

  return (
    <TradingChartsView
      style={{ height: 480 }}
      chartId={chartId}
      additionalSeries={[
        {
          seriesId: 'sma-20',
          type: 'line',
          paneId: 'main',
          priceScaleId: 'main',
          source: { type: 'ohlcvSma', seriesId: 'main', period: 20 },
          appearance: { color: '#2E90F5', width: 1.5 },
        },
        {
          seriesId: 'ema-50',
          type: 'line',
          paneId: 'main',
          priceScaleId: 'main',
          source: {
            type: 'ohlcvEma',
            seriesId: 'main',
            period: 50,
            valueSource: 'close',
          },
          appearance: {
            color: '#F5A623',
            width: 2,
            style: 'dashed',
          },
        },
      ]}
    />
  );
}
Configuration reference
All indicators also require seriesId, paneId, priceScaleId; visible defaults to true.
| Option | Values | Default |
|---|---|---|
source.type | 'ohlcvSma' or 'ohlcvEma' | Required |
source.seriesId | OHLC source ID | Required |
source.period | Integer 1…4294967295 | Required |
source.valueSource | open, high, low, close | close |
gapThresholdMs | Positive milliseconds | Unset; continuous path |
appearance | ChartLineAppearance | Theme fallback; width 1.5, solid stroke |
See Types for every appearance field and Additional series for shared identifiers.