Series types
A series is the set of prices drawn on a chart. Its type determines how you see those prices: a candlestick shows what happened within each interval, while a line makes the path of a single price easier to follow.
Choose the main series with the series prop. Use candles or OHLC bars when users need opening, highest, lowest and closing prices together. Use a line or area when the screen needs a simpler price overview. Each shape has its own appearance settings.
All main series use the same OHLCV data: open, high, low, close and volume. Changing the type preserves the stored candles, visible time range, vertical scale and selection. Line and area charts also take OhlcCandle objects; source chooses which price field to draw. For volume bars, use an additional histogram series.
Candlestick
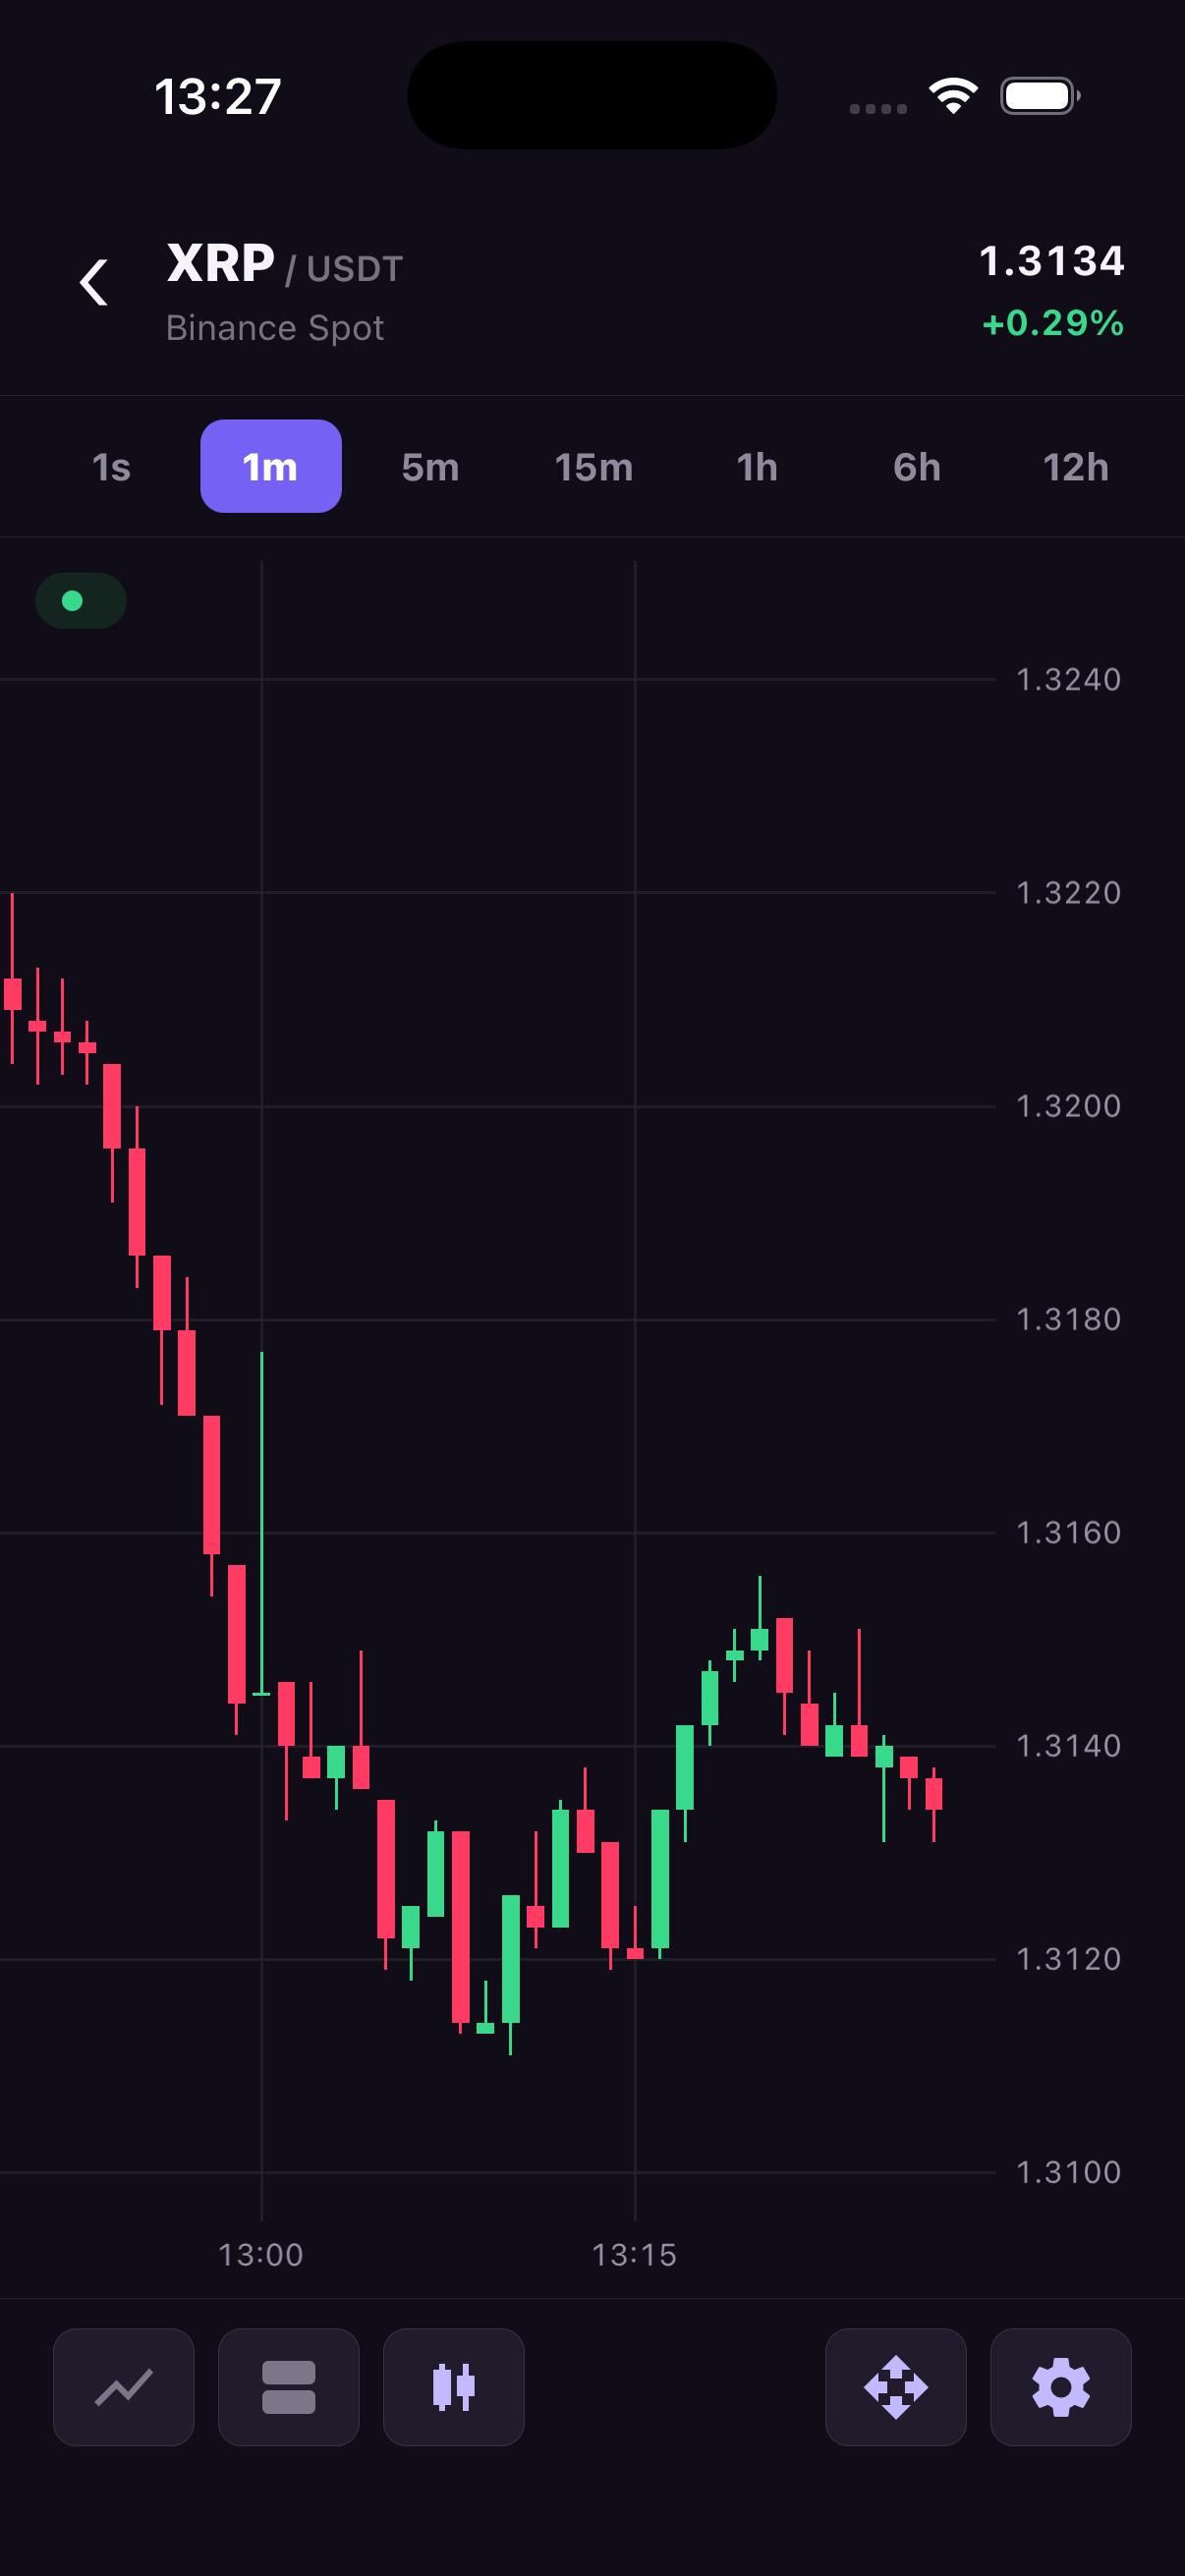
A candlestick shows four prices for one interval. Its body spans open to close, and its wick spans low to high. Use it when readers need to inspect the range and direction of each candle. upColor applies when close is at least open; downColor applies when it is lower.
| Property | Type / values | Default | Description |
|---|---|---|---|
series.type | 'candlestick' | 'candlestick' | Filled OHLC candle bodies with high/low wicks. |
appearance.candles.upColor | #RRGGBB or #RRGGBBAA | theme.upColor | Color used when close >= open. |
appearance.candles.downColor | #RRGGBB or #RRGGBBAA | theme.downColor | Color used when close < open. |
appearance.candles.radius | Non-negative number | 0 | Body corner radius in iOS points or Android density-independent units. Wicks remain square. |
import { useEffect } from 'react';
import {
  TradingCharts,
  TradingChartsView,
  type OhlcCandle,
} from 'react-native-trading-charts';

// Deterministic sample data. Replace this with your market-data feed.
const history: OhlcCandle[] = Array.from({ length: 80 }, (_, index) => {
  const open = 100 + Math.sin(index / 5) * 8;
  const close = 100 + Math.sin((index + 1) / 5) * 8;
  return {
    timestamp: 1_720_000_000_000 + index * 60_000,
    open,
    high: Math.max(open, close) + 2,
    low: Math.min(open, close) - 2,
    close,
    volume: 10 + index,
  };
});

const chartId = 'candlestick';

export function Example() {
  useEffect(() => {
    TradingCharts.setHistory(chartId, history);
  }, []);

  return (
    <TradingChartsView
      style={{ height: 480 }}
      chartId={chartId}
      series={{ type: 'candlestick' }}
      appearance={{
        candles: { upColor: '#00A88F', downColor: '#FF334F', radius: 3 },
      }}
    />
  );
}
Hollow candlestick
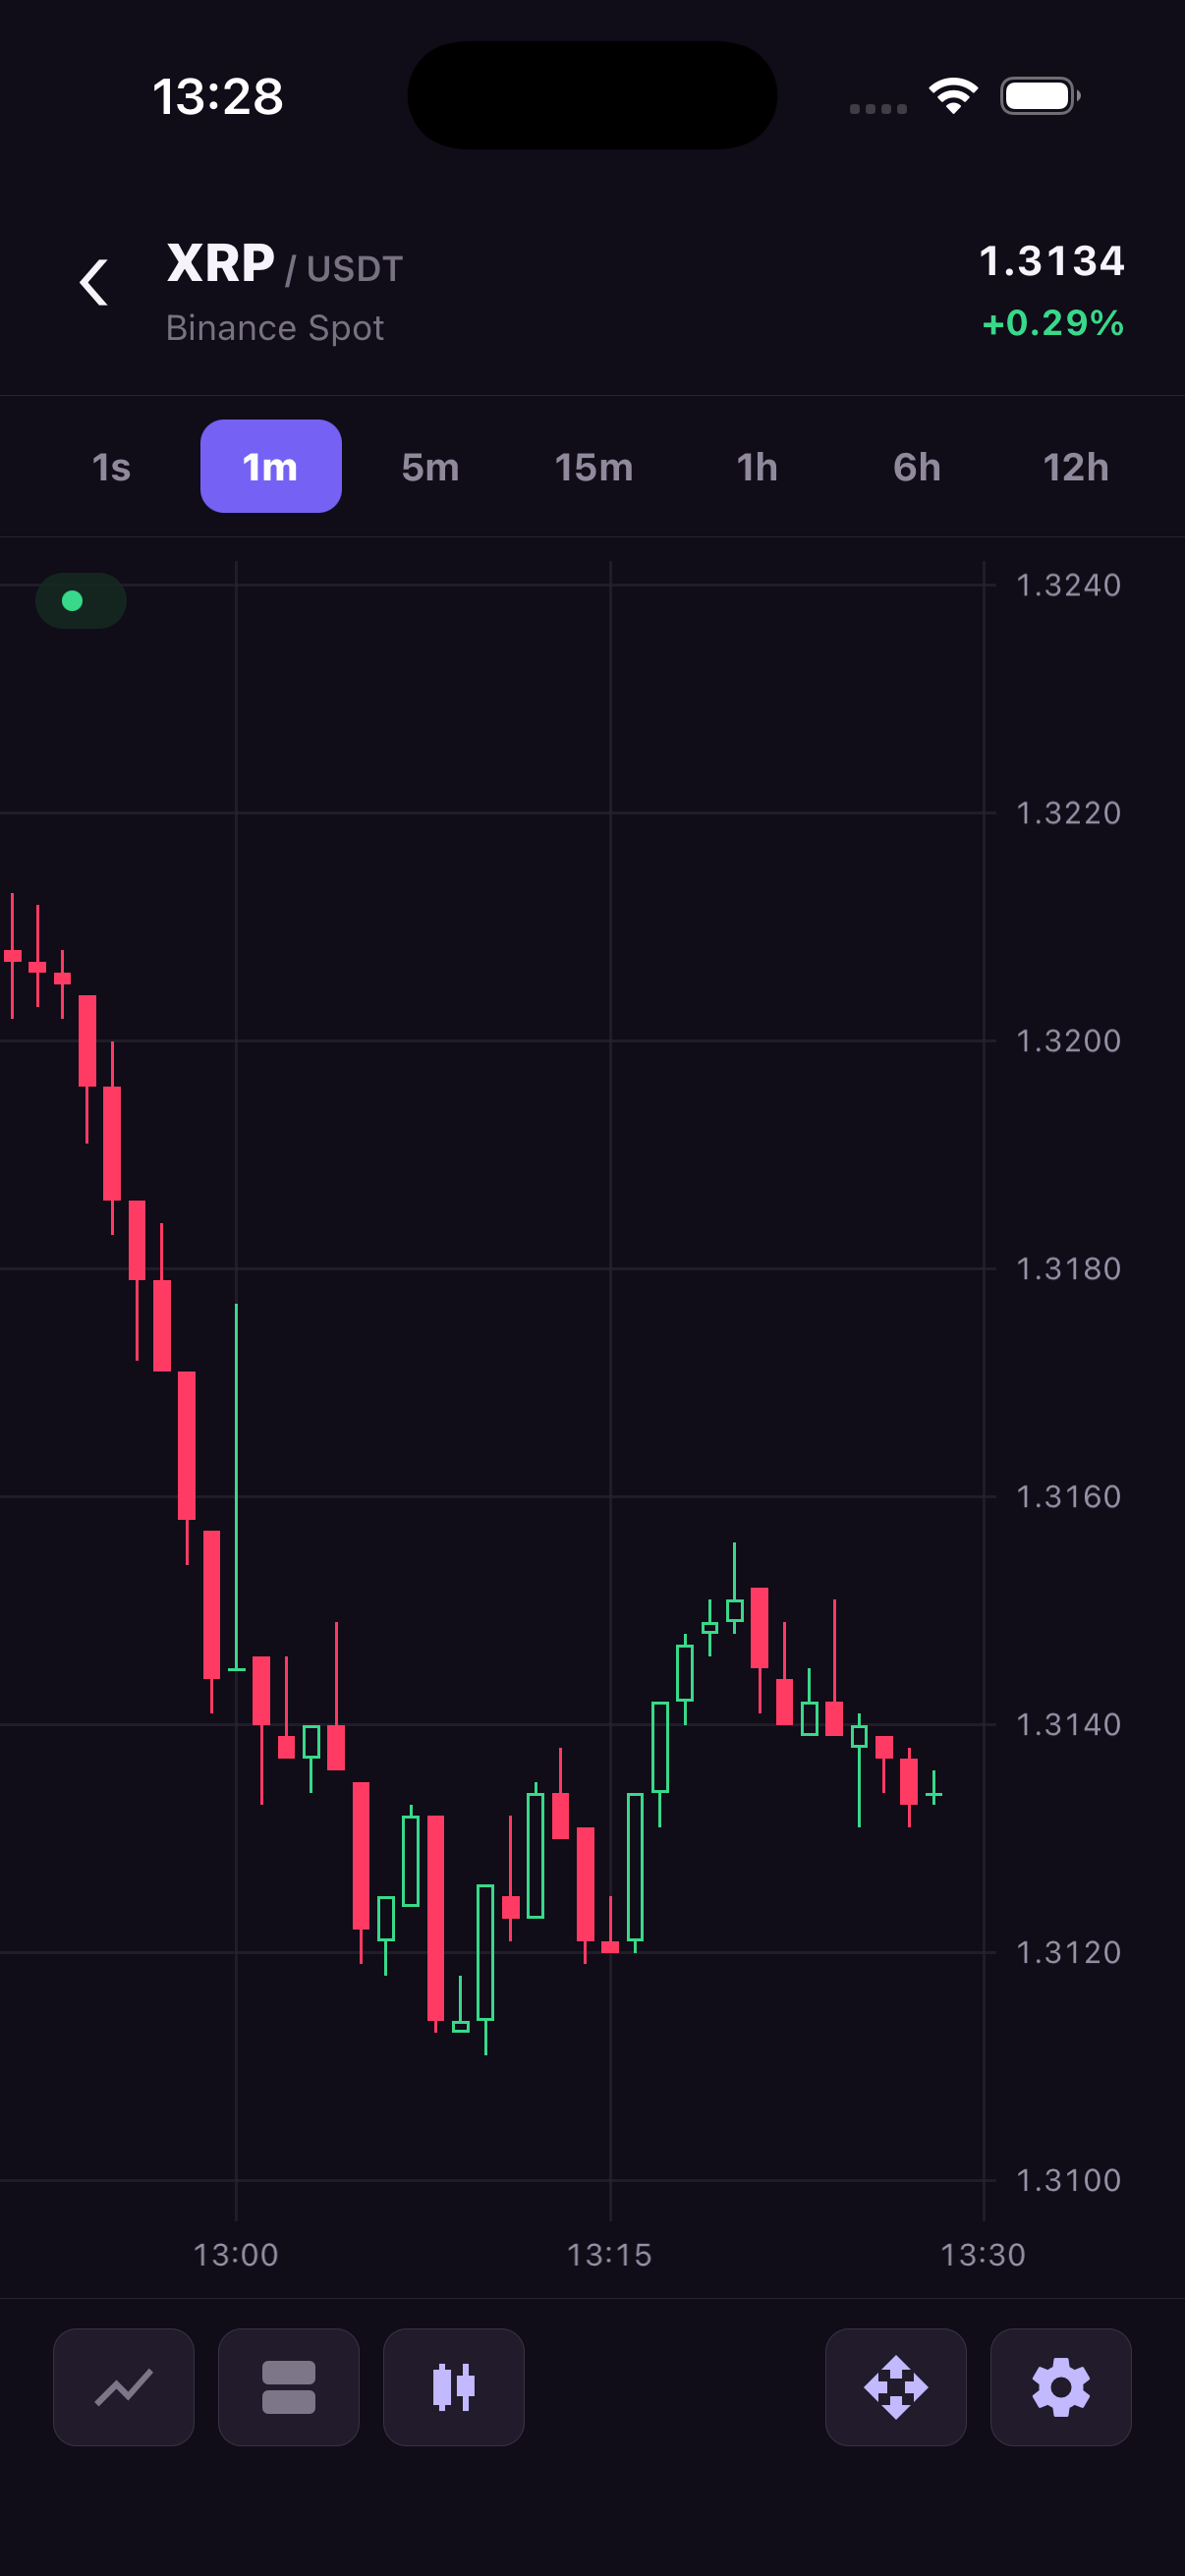
Hollow candles show the same OHLC values as filled candles. Rising bodies have an outline and falling bodies are filled, so direction is visible from the body shape as well as its color. Choose this style when that distinction suits your screen.
| Property | Type / values | Default | Description |
|---|---|---|---|
series.type | 'hollowCandlestick' | Not applicable | Uses outlined rising bodies and filled falling bodies. |
appearance.candles.upColor | #RRGGBB or #RRGGBBAA | theme.upColor | Rising outline and wick color. |
appearance.candles.downColor | #RRGGBB or #RRGGBBAA | theme.downColor | Falling body and wick color. |
appearance.candles.radius | Non-negative number | 0 | Corner radius for outlined rising and filled falling bodies. |
The hollow outline uses the same native thickness as the wick.
import { useEffect } from 'react';
import {
  TradingCharts,
  TradingChartsView,
  type OhlcCandle,
} from 'react-native-trading-charts';

// Deterministic sample data. Replace this with your market-data feed.
const history: OhlcCandle[] = Array.from({ length: 80 }, (_, index) => {
  const open = 100 + Math.sin(index / 5) * 8;
  const close = 100 + Math.sin((index + 1) / 5) * 8;
  return {
    timestamp: 1_720_000_000_000 + index * 60_000,
    open,
    high: Math.max(open, close) + 2,
    low: Math.min(open, close) - 2,
    close,
    volume: 10 + index,
  };
});

const chartId = 'hollow-candlestick';

export function Example() {
  useEffect(() => {
    TradingCharts.setHistory(chartId, history);
  }, []);

  return (
    <TradingChartsView
      style={{ height: 480 }}
      chartId={chartId}
      series={{ type: 'hollowCandlestick' }}
      appearance={{ candles: { upColor: '#00A88F', downColor: '#FF334F' } }}
    />
  );
}
OHLC bar
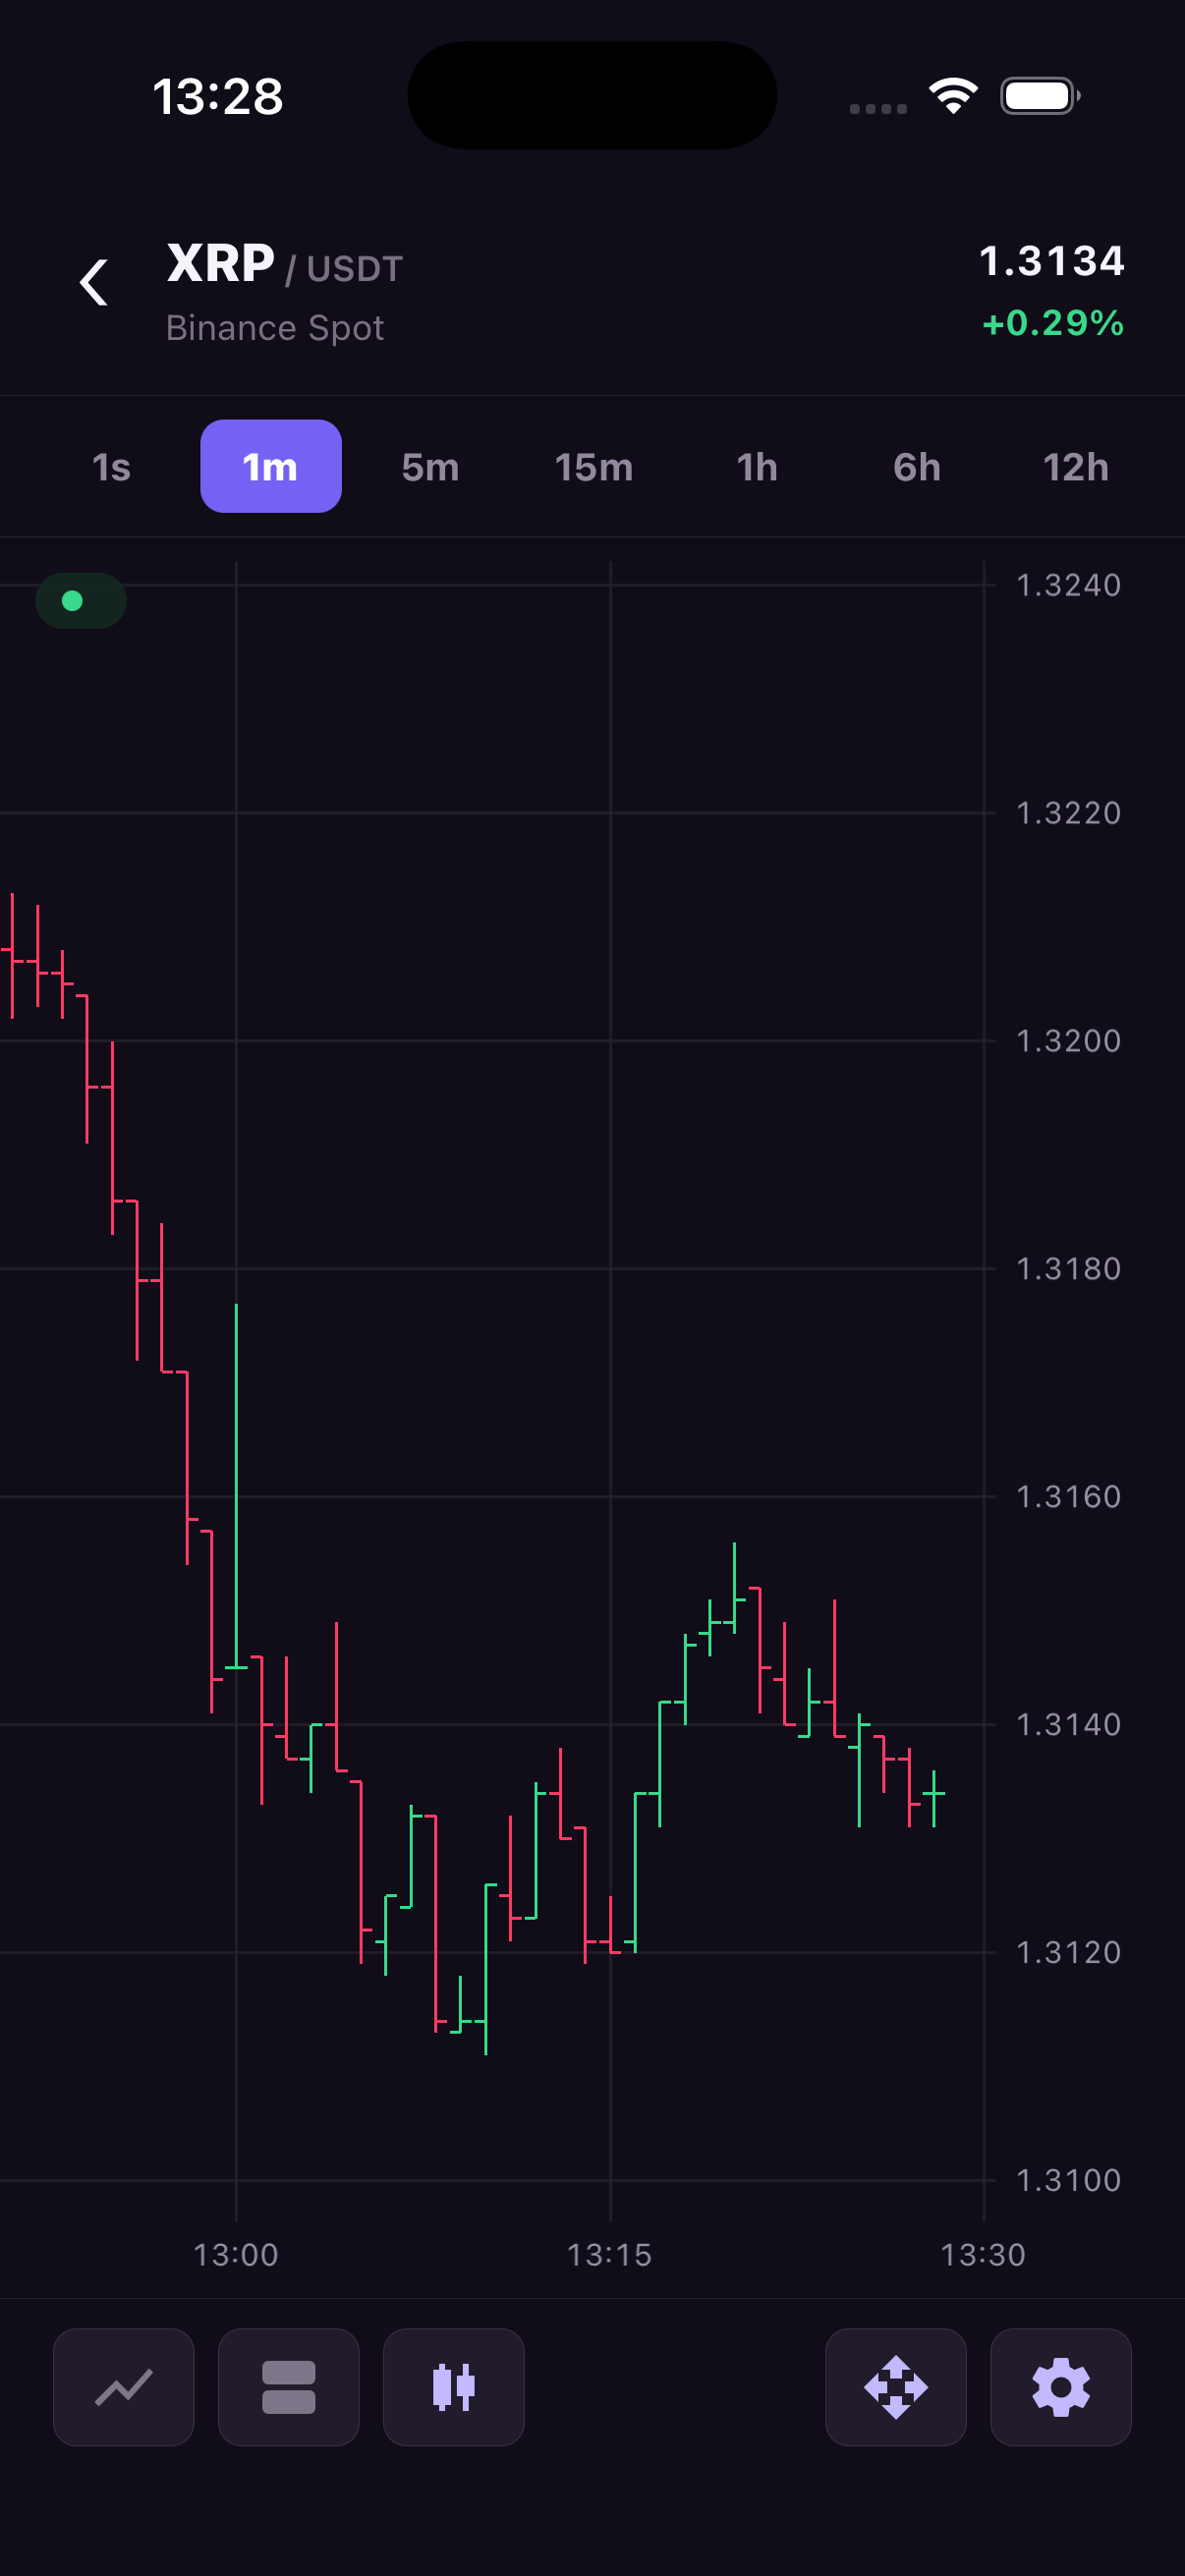
An OHLC bar uses a vertical low-to-high stem with a short open tick on the left and close tick on the right. It carries the same four prices as a candle with less filled area. Set lineWidth to keep the ticks readable at your chosen zoom.
| Property | Type / values | Default | Description |
|---|---|---|---|
series.type | 'bar' | Not applicable | Draws a high-low stem, left open tick, and right close tick. |
appearance.bars.upColor | Color | appearance.candles.upColor | Rising bar color. |
appearance.bars.downColor | Color | appearance.candles.downColor | Falling bar color. |
appearance.bars.lineWidth | Positive number | 1 | Width in iOS points or Android density-independent units. |
import { useEffect } from 'react';
import {
  TradingCharts,
  TradingChartsView,
  type OhlcCandle,
} from 'react-native-trading-charts';

// Deterministic sample data. Replace this with your market-data feed.
const history: OhlcCandle[] = Array.from({ length: 80 }, (_, index) => {
  const open = 100 + Math.sin(index / 5) * 8;
  const close = 100 + Math.sin((index + 1) / 5) * 8;
  return {
    timestamp: 1_720_000_000_000 + index * 60_000,
    open,
    high: Math.max(open, close) + 2,
    low: Math.min(open, close) - 2,
    close,
    volume: 10 + index,
  };
});

const chartId = 'ohlc-bar';

export function Example() {
  useEffect(() => {
    TradingCharts.setHistory(chartId, history);
  }, []);

  return (
    <TradingChartsView
      style={{ height: 480 }}
      chartId={chartId}
      series={{ type: 'bar' }}
      appearance={{
        bars: { upColor: '#00A88F', downColor: '#FF334F', lineWidth: 1 },
      }}
    />
  );
}
Line
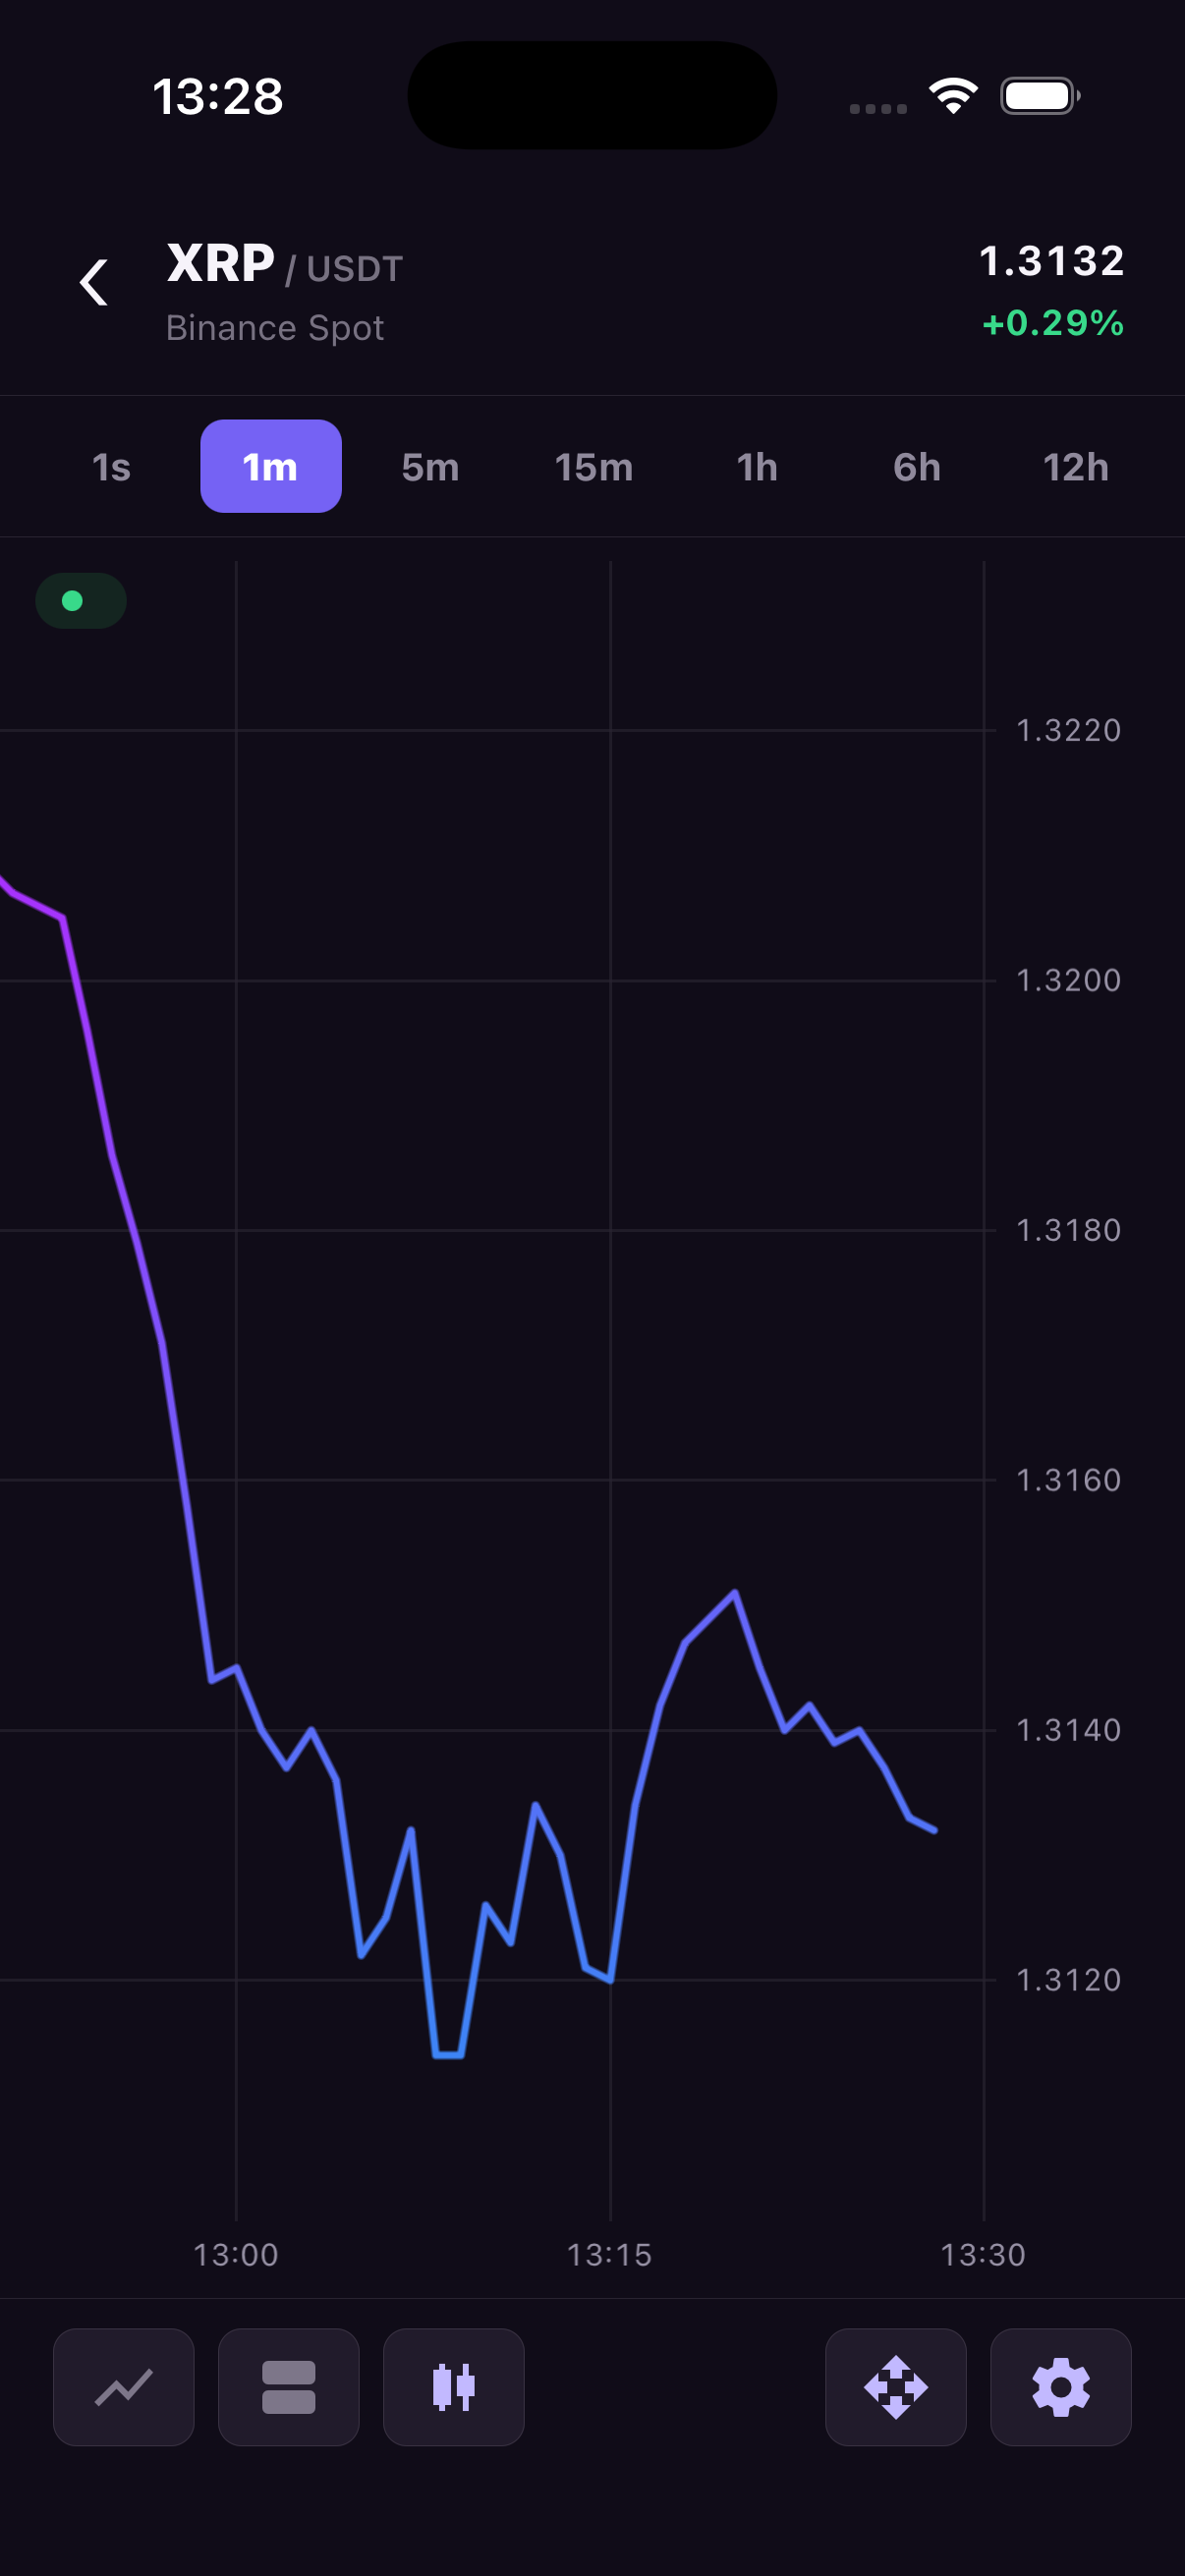
A line connects one selected price from each candle, usually the close. Use it for a price overview where individual candle bodies would add detail the screen does not need. Set source to choose the OHLC field, and gapThresholdMs to leave breaks across large time gaps.
| Property | Type / values | Default | Description |
|---|---|---|---|
series.type | 'line' | Not applicable | Joins values from one OHLC field into a line. |
series.source | 'open', 'high', 'low', 'close' | 'close' | Value used for geometry, autoscale, extrema, and current price. |
series.gapThresholdMs | Positive milliseconds | undefined | Splits the line when a timestamp gap exceeds this value. |
appearance.line.width | Positive number | 1.5 | Native stroke width. |
appearance.line.color | Color | theme.upColor | Solid line color and fallback active-series color. |
appearance.line.rounded | Boolean | true | Round caps and joins on the main chart; false restores sharp joins and flat caps. |
appearance.line.style | 'solid' or 'dashed' | 'solid' | Solid or dashed stroke, drawn consistently on both platforms. |
appearance.line.gradient.topColor | Color | undefined | Top color of an optional vertical stroke gradient. |
appearance.line.gradient.bottomColor | Color | undefined | Bottom color of an optional vertical stroke gradient. |
import { useEffect } from 'react';
import {
  TradingCharts,
  TradingChartsView,
  type OhlcCandle,
} from 'react-native-trading-charts';

// Deterministic sample data. Replace this with your market-data feed.
const history: OhlcCandle[] = Array.from({ length: 80 }, (_, index) => {
  const open = 100 + Math.sin(index / 5) * 8;
  const close = 100 + Math.sin((index + 1) / 5) * 8;
  return {
    timestamp: 1_720_000_000_000 + index * 60_000,
    open,
    high: Math.max(open, close) + 2,
    low: Math.min(open, close) - 2,
    close,
    volume: 10 + index,
  };
});

const chartId = 'line';

export function Example() {
  useEffect(() => {
    TradingCharts.setHistory(chartId, history);
  }, []);

  return (
    <TradingChartsView
      style={{ height: 480 }}
      chartId={chartId}
      series={{ type: 'line', source: 'close', gapThresholdMs: 300_000 }}
      appearance={{ line: { width: 2, color: '#2E90F5' } }}
    />
  );
}
Area
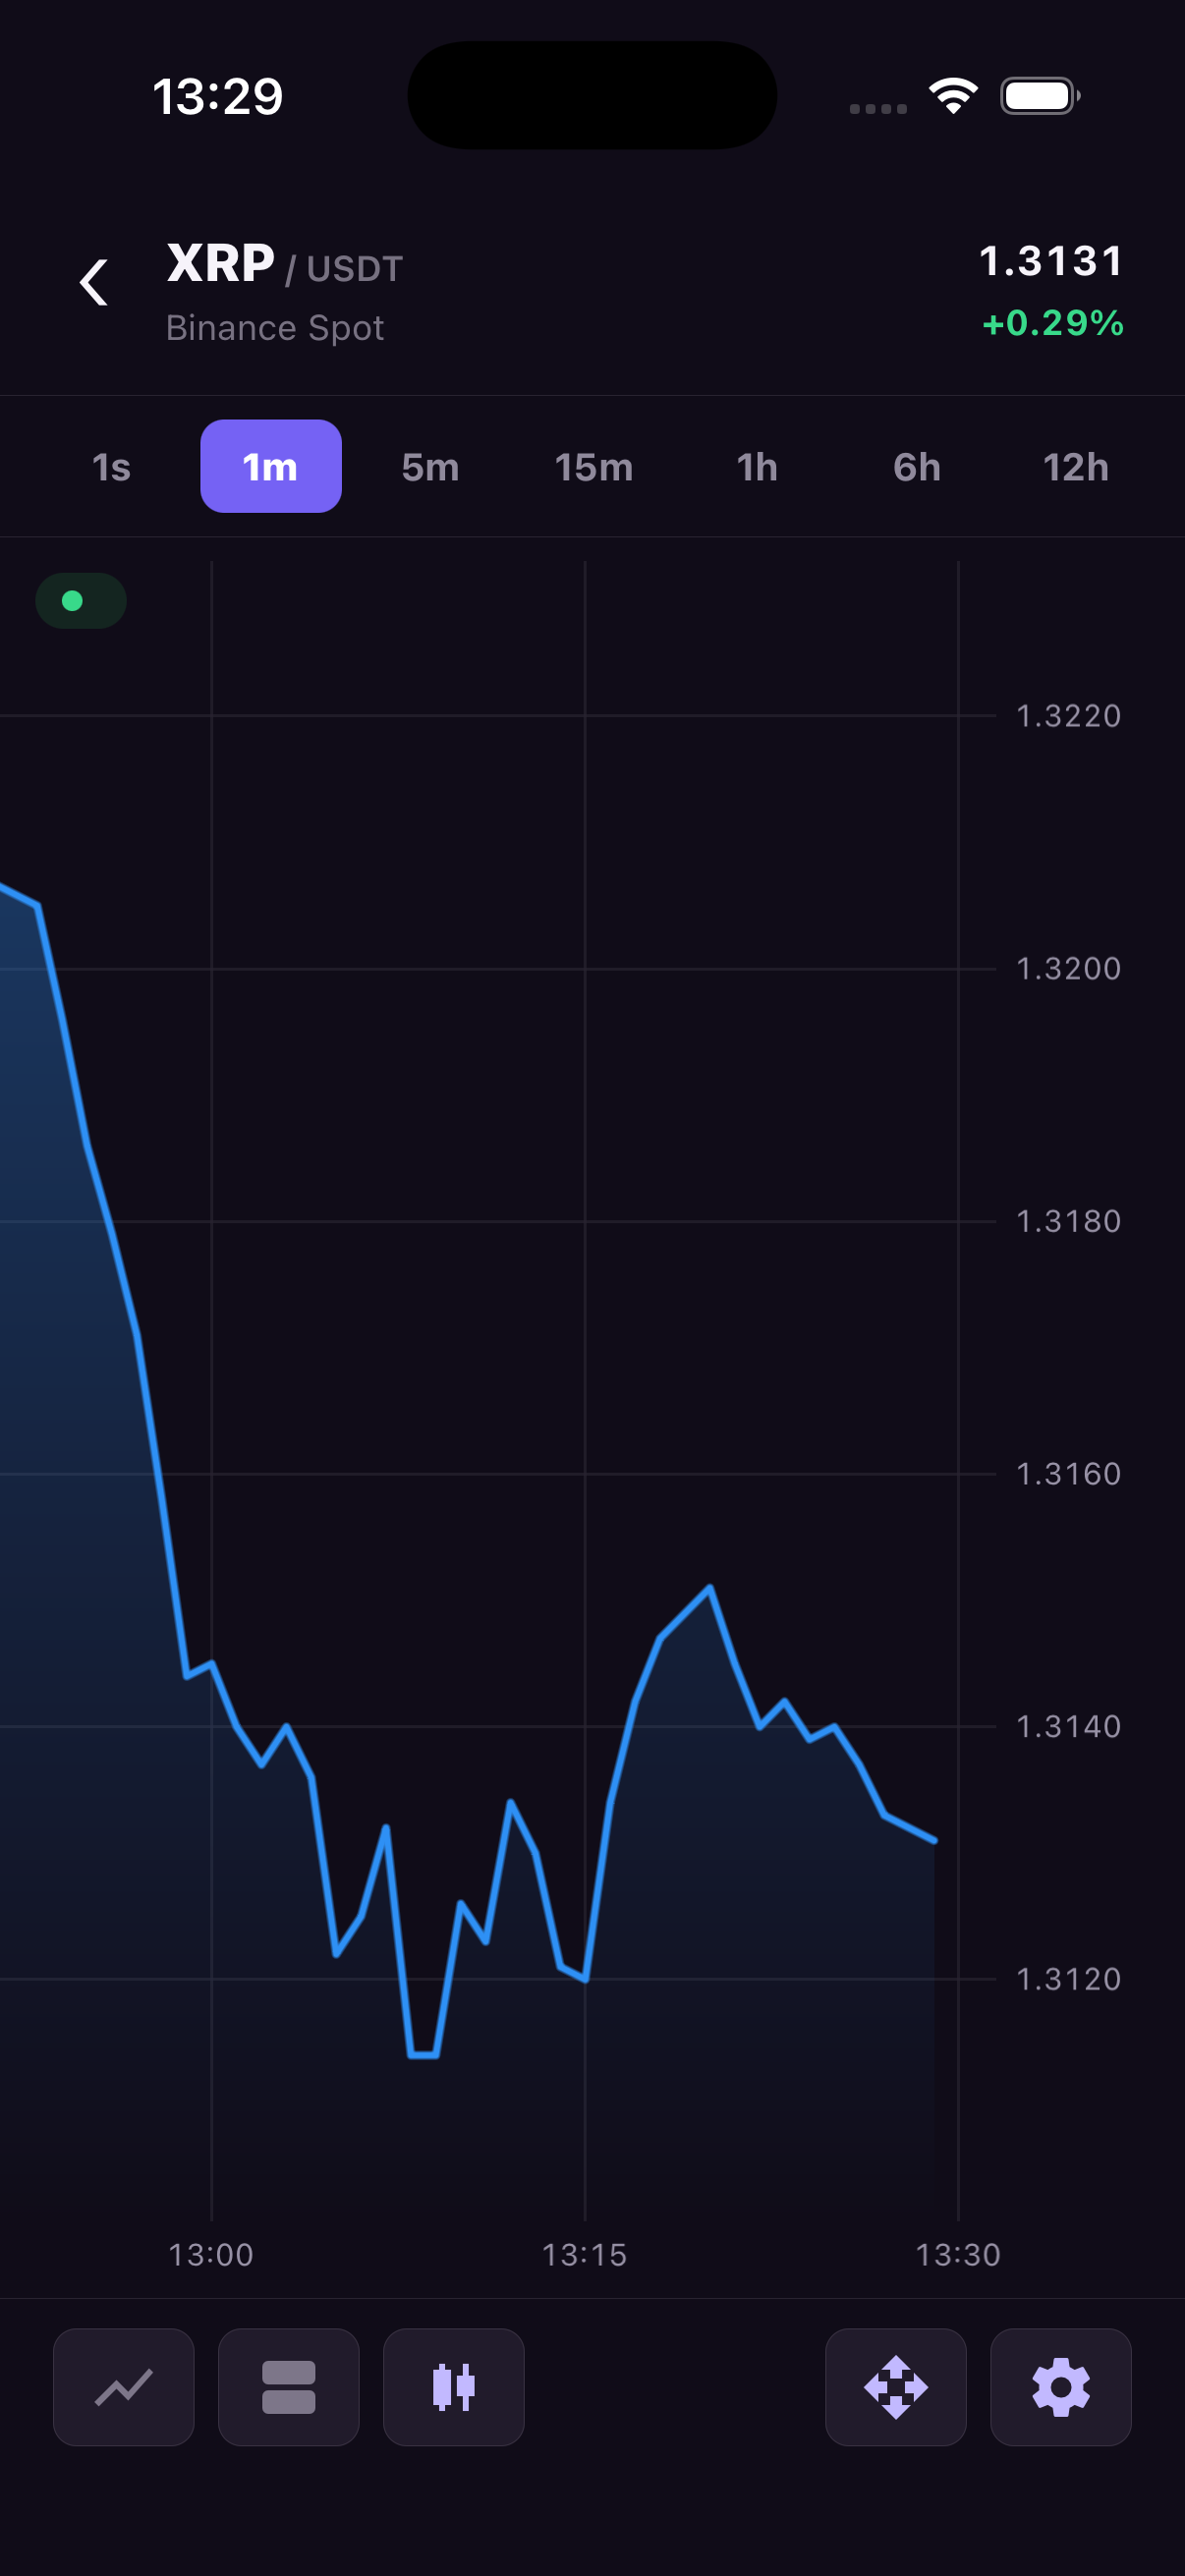
An area chart adds a fill beneath a price line. It works for the same price-over-time views as a line chart, with the fill making the shape more visible. Style the outline separately from the fill; the data still comes from the selected OHLC field.
| Property | Type / values | Default | Description |
|---|---|---|---|
series.type | 'area' | Not applicable | Renders an OHLC source line with a pane-wide fill. |
series.source | 'open', 'high', 'low', 'close' | 'close' | Value used by the series. |
series.gapThresholdMs | Positive milliseconds | undefined | Splits line and fill across larger gaps. |
appearance.area.width | Positive number | 1.5 | Outline width. |
appearance.area.color | Color | theme.upColor | Outline color and base color for default fill. |
appearance.area.gradient | { topColor, bottomColor } | undefined | Optional vertical gradient for the outline. |
appearance.area.rounded | Boolean | true | Round outline caps and joins on the main chart only. |
appearance.area.style | 'solid' or 'dashed' | 'solid' | Outline style; the area fill remains continuous. |
appearance.area.fill.topColor | Color | Area color with 0x40 alpha | Fill color at the pane top. |
appearance.area.fill.bottomColor | Color | Area color with 0x00 alpha | Fill color at the pane bottom. |
import { useEffect } from 'react';
import {
  TradingCharts,
  TradingChartsView,
  type OhlcCandle,
} from 'react-native-trading-charts';

// Deterministic sample data. Replace this with your market-data feed.
const history: OhlcCandle[] = Array.from({ length: 80 }, (_, index) => {
  const open = 100 + Math.sin(index / 5) * 8;
  const close = 100 + Math.sin((index + 1) / 5) * 8;
  return {
    timestamp: 1_720_000_000_000 + index * 60_000,
    open,
    high: Math.max(open, close) + 2,
    low: Math.min(open, close) - 2,
    close,
    volume: 10 + index,
  };
});

const chartId = 'area';

export function Example() {
  useEffect(() => {
    TradingCharts.setHistory(chartId, history);
  }, []);

  return (
    <TradingChartsView
      style={{ height: 480 }}
      chartId={chartId}
      series={{ type: 'area', source: 'close' }}
      appearance={{
        area: {
          width: 2,
          color: '#2E90F5',
          fill: { topColor: '#2E90F566', bottomColor: '#2E90F500' },
        },
      }}
    />
  );
}
The rounded options apply only to the main line or area chart, not to indicators, additional series, price lines, or crosshair lines. Edge antialiasing stays enabled in both modes. Rounded caps extend half the stroke width past each endpoint, including dash endpoints, so wide dashed strokes have smaller visible gaps.
appearance={{
  line: { rounded: false },
  area: { rounded: false },
}}
Baseline
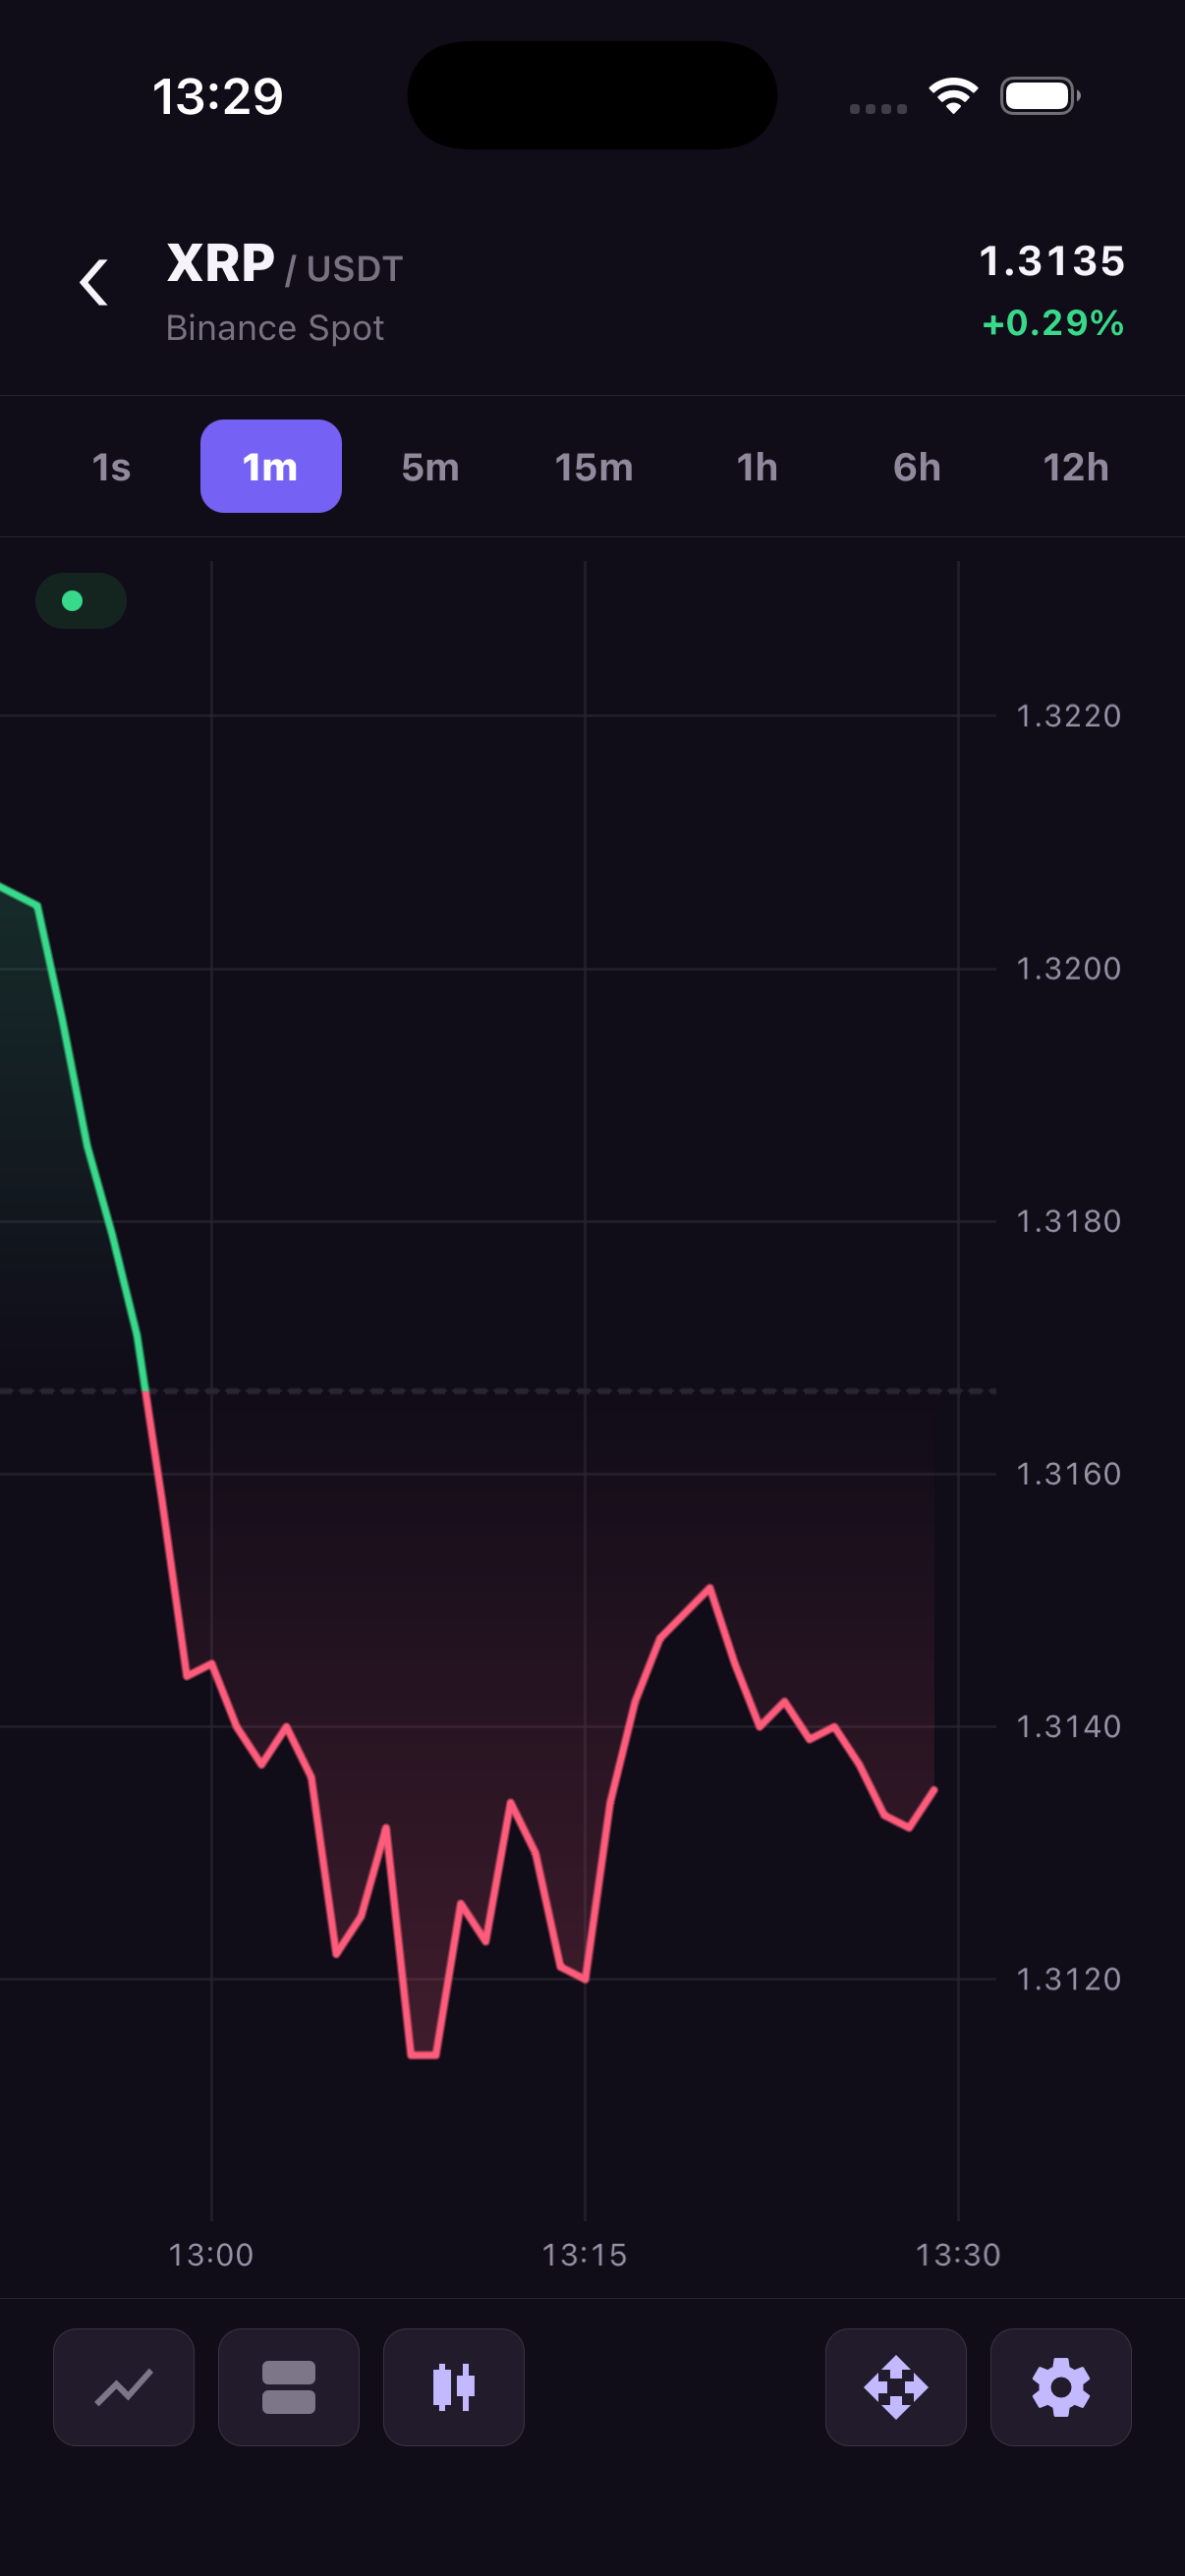
A baseline chart fills the space between a price line and a reference level. Above the level it uses the upper color palette; below it uses the lower palette. Both the outline and fill change color exactly at crossings. Data, OHLC source selection and time gaps work as for Line/Area.
| Property | Default | Meaning |
|---|---|---|
series.type | — | 'baseline' |
series.source | 'close' | 'open', 'high', 'low', or 'close' |
series.gapThresholdMs | Unset | Break outline and fill across larger timestamp gaps |
series.baseValue | { type: 'percentage', value: 50 } | Fixed { type: 'price', value } or pane-height percentage |
appearance.baseline.width | 1.5 | Positive outline width in points / dp |
appearance.baseline.style | 'solid' | 'solid' or 'dashed'; fill remains continuous |
appearance.baseline.rounded | true | Round caps and joins, main series only |
appearance.baseline.topLineColor | theme.upColor | Outline above the base |
appearance.baseline.bottomLineColor | theme.downColor | Outline below the base |
appearance.baseline.topFill.topColor | Upper color, alpha 0x40 | Fill color at the pane top |
appearance.baseline.topFill.bottomColor | Upper color, alpha 0x00 | Upper fill color at the base |
appearance.baseline.bottomFill.topColor | Lower color, alpha 0x00 | Lower fill color at the base |
appearance.baseline.bottomFill.bottomColor | Lower color, alpha 0x40 | Fill color at the pane bottom |
appearance.baseline.baseLine.visible | true | Show the reference line |
appearance.baseline.baseLine.color | theme.gridColor | Reference line color |
appearance.baseline.baseLine.width | 1 | Positive reference line width in points / dp |
appearance.baseline.baseLine.style | 'dashed' | 'solid' or 'dashed' |
Percentage is measured upward from the bottom of the plot: 0 is the bottom and 100 the top. It follows the final Y range after autoscale or manual Y scaling. Each additional pane resolves its own percentage level. A fixed price may be zero or negative; it must be finite. Autoscale follows data, so a distant base can leave the screen without compressing the price line. Geometry remains clipped to the pane.
Current-price line and badge colors follow the selected value relative to the base (equality uses the upper color). Explicit appearance.currentPrice overrides still apply. Changing the chart type preserves history, viewport and selection.
import { useEffect } from 'react';
import {
  TradingCharts,
  TradingChartsView,
  type OhlcCandle,
} from 'react-native-trading-charts';

// Deterministic sample data. Replace this with your market-data feed.
const history: OhlcCandle[] = Array.from({ length: 80 }, (_, index) => {
  const open = 100 + Math.sin(index / 5) * 8;
  const close = 100 + Math.sin((index + 1) / 5) * 8;
  return {
    timestamp: 1_720_000_000_000 + index * 60_000,
    open,
    high: Math.max(open, close) + 2,
    low: Math.min(open, close) - 2,
    close,
    volume: 10 + index,
  };
});

const chartId = 'baseline';

export function Example() {
  useEffect(() => {
    TradingCharts.setHistory(chartId, history);
  }, []);

  return (
    <TradingChartsView
      style={{ height: 480 }}
      chartId={chartId}
      series={{
        type: 'baseline',
        source: 'close',
        baseValue: { type: 'price', value: 100 },
      }}
      appearance={{
        baseline: {
          width: 2,
          topLineColor: '#009688',
          bottomLineColor: '#FF3344',
          topFill: { topColor: '#00968866', bottomColor: '#00968814' },
          bottomFill: { topColor: '#FF334414', bottomColor: '#FF334466' },
          baseLine: {
            visible: true,
            style: 'dashed',
            width: 1,
            color: '#888888',
          },
        },
      }}
    />
  );
}
Baseline is also available through additionalSeries and addSeries(). Each series has its own baseValue; omitted appearance fields inherit the chart's appearance.baseline, including when the main chart uses another type. Additional series do not support rounded caps/joins.
import { useEffect } from 'react';
import {
  TradingCharts,
  TradingChartsView,
  type OhlcCandle,
} from 'react-native-trading-charts';

// Deterministic sample data. Replace this with your market-data feed.
const history: OhlcCandle[] = Array.from({ length: 80 }, (_, index) => {
  const open = 100 + Math.sin(index / 5) * 8;
  const close = 100 + Math.sin((index + 1) / 5) * 8;
  return {
    timestamp: 1_720_000_000_000 + index * 60_000,
    open,
    high: Math.max(open, close) + 2,
    low: Math.min(open, close) - 2,
    close,
    volume: 10 + index,
  };
});

const chartId = 'baseline-comparison';

export function Example() {
  useEffect(() => {
    TradingCharts.setHistory(chartId, history);
    TradingCharts.addSeries(chartId, {
      type: 'baseline',
      seriesId: 'comparison',
      paneId: 'main',
      priceScaleId: 'main',
      source: 'close',
      baseValue: { type: 'percentage', value: 50 },
      appearance: { width: 2, baseLine: { visible: false } },
    });
    TradingCharts.setSeriesData(chartId, 'comparison', history);
    return () => TradingCharts.removeSeries(chartId, 'comparison');
  }, []);

  return <TradingChartsView style={{ height: 480 }} chartId={chartId} />;
}