Gestures & viewport
The viewport is the portion of your loaded data that the chart currently shows. Users pan to inspect earlier candles and zoom to change how much history fits on screen. Adjusting the price scale lets them inspect a smaller or larger vertical range.
Native gestures handle these interactions. A horizontal pan has momentum and stops at the available data boundaries. Pinching zooms the time range. A one-finger vertical drag that starts on the Y-axis scales that pane's visible values.
Use gestures to enable the interactions your screen needs. initialVisibleCount and defaultScale set the initial view. For buttons such as "Fit all" or "Latest data", use the commands shown below.
| Property | Type / values | Default | Description |
|---|---|---|---|
initialVisibleCount | Positive integer | 100 | Initial candle-count target. |
defaultScale | Positive number | 1 | Initial horizontal scale; above 1 zooms in. |
gestures.pan | boolean | true | Enables horizontal pan and momentum. |
gestures.zoom | boolean | true | Enables pinch zoom. |
gestures.yAxisScale | boolean | gestures.zoom | Enables vertical scaling from an axis lane. |
yAxis.defaultScale | Number from 0.1 to 10 | 1 | Default vertical scale. |
TradingCharts.zoom(chartId, scale) applies programmatic horizontal scaling anchored to the right edge. TradingCharts.fitContent(chartId) shows all loaded history and restores automatic Y scaling. TradingCharts.scrollToRealTime(chartId) smoothly returns the current viewport to the latest loaded data on the right while preserving horizontal and price scales. These commands work even when touch pan or zoom is disabled. Only user gestures emit scale events.
Touch and programmatic controls
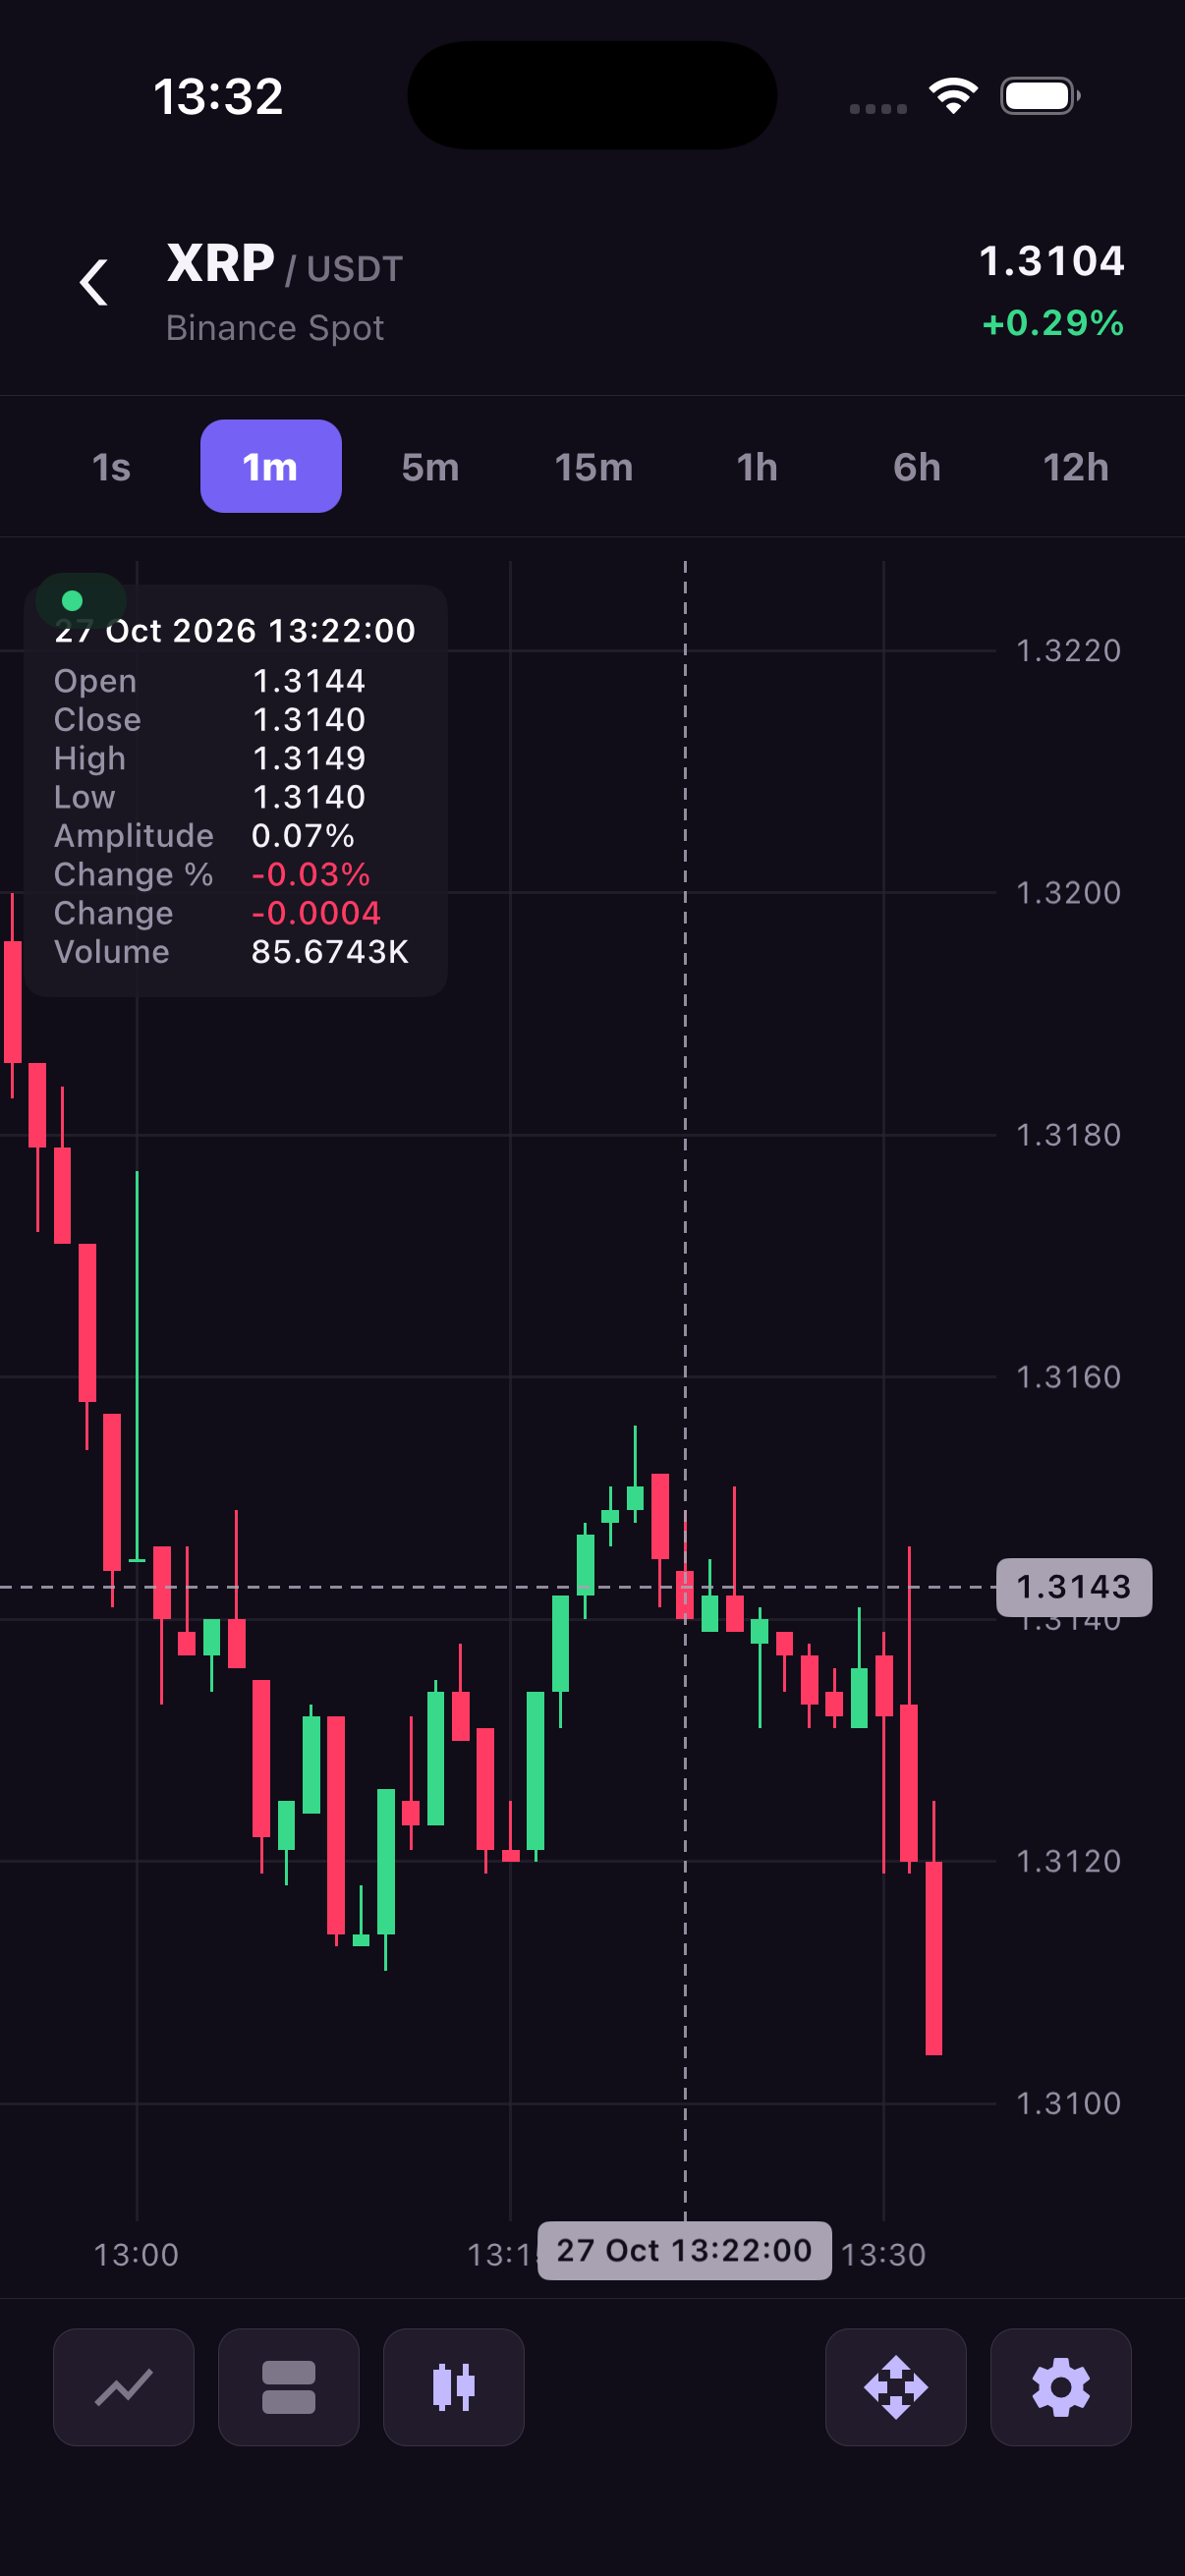
import { useEffect } from 'react';
import { Button, View } from 'react-native';
import {
  TradingCharts,
  TradingChartsView,
  type OhlcCandle,
} from 'react-native-trading-charts';

// Deterministic sample data. Replace this with your market-data feed.
const history: OhlcCandle[] = Array.from({ length: 80 }, (_, index) => {
  const open = 100 + Math.sin(index / 5) * 8;
  const close = 100 + Math.sin((index + 1) / 5) * 8;
  return {
    timestamp: 1_720_000_000_000 + index * 60_000,
    open,
    high: Math.max(open, close) + 2,
    low: Math.min(open, close) - 2,
    close,
    volume: 10 + index,
  };
});

const chartId = 'gestures';

export function Example() {
  useEffect(() => {
    TradingCharts.setHistory(chartId, history);
  }, []);

  return (
    <View>
      <TradingChartsView
        style={{ height: 420 }}
        chartId={chartId}
        initialVisibleCount={40}
        defaultScale={1}
        gestures={{ pan: true, zoom: true, yAxisScale: true }}
        yAxis={{ defaultScale: 1 }}
      />
      <Button title="Zoom in" onPress={() => TradingCharts.zoom(chartId, 2)} />
      <Button
        title="Latest data"
        onPress={() => TradingCharts.scrollToRealTime(chartId)}
      />
      <Button
        title="Fit all"
        onPress={() => TradingCharts.fitContent(chartId)}
      />
    </View>
  );
}