Panes
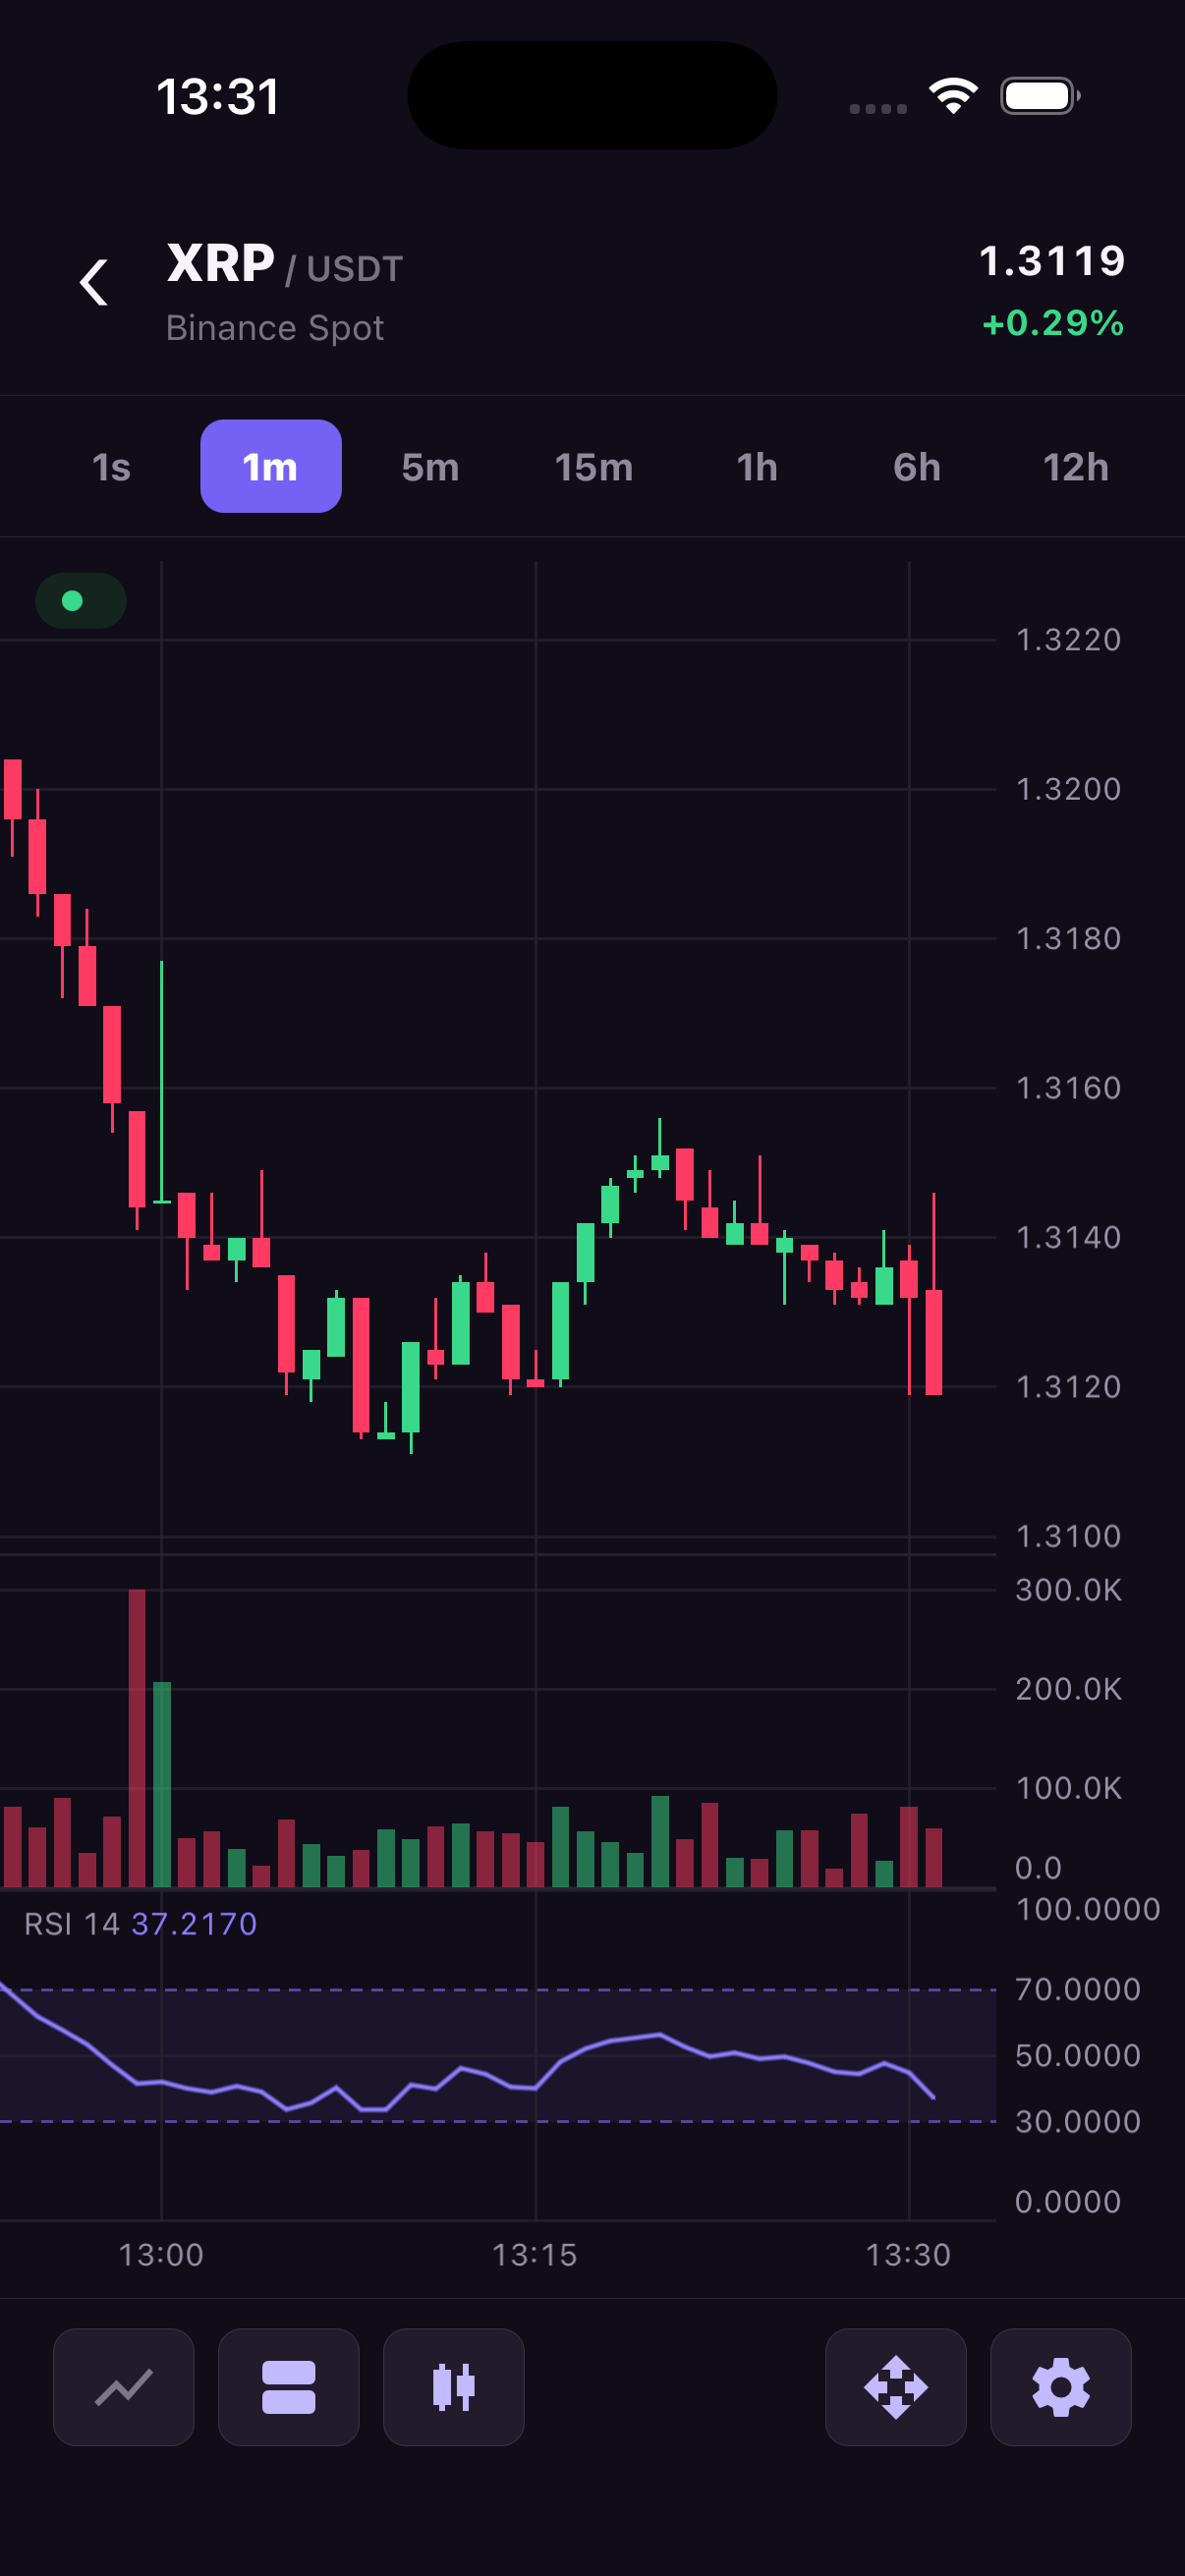
A pane is a separate plot area within one chart. For example, a trading screen can show candles at the top, volume underneath and RSI at the bottom. Each pane has its own vertical scale, so a large volume value does not flatten the price chart.
The panes share one time axis. Panning or zooming changes the visible time range for all of them, so values at the same timestamp stay aligned. heightWeight controls how much vertical space each pane gets; users can drag the separators when resizing is enabled.
Define the layout with panes, then assign each additional series to a paneId and its priceScaleId. Include the reserved main pane and main price scale whenever you supply this prop. Each pane supports one visible price scale. Price and volume panes calculate their ranges independently; RSI uses a fixed range of 0 to 100.
Pane properties
Give the price pane more space with a larger heightWeight, and use minHeight to keep smaller panes readable. Configure each scale with a format appropriate to its values.
| Property | Type / values | Default | Description |
|---|---|---|---|
paneId | Unique non-empty string | Required | Pane identifier; main is reserved for the primary pane. |
heightWeight | Positive number | Required | Relative height compared with other panes. |
minHeight | Positive number | 48 | Minimum height in native view units. |
priceScale.priceScaleId | Unique non-empty string | Required | Scale ID; the main pane must use main. |
priceScale.visible | boolean | true | Shows the pane price scale. |
priceScale.scaleMargins | { top, bottom } | Main: { 0.2, 0.1 }; others: { 0.1, 0 } | Pane-specific autoscale margins; their sum must leave at least 1e-6 of the plot area. |
priceScale.valueFormat | Price, compact, significant, or volume format | Main Y format | Pane scale number format. |
import { useEffect } from 'react';
import {
  TradingCharts,
  TradingChartsView,
  type OhlcCandle,
  type ChartPaneOptions,
} from 'react-native-trading-charts';

// Deterministic sample data. Replace this with your market-data feed.
const history: OhlcCandle[] = Array.from({ length: 80 }, (_, index) => {
  const open = 100 + Math.sin(index / 5) * 8;
  const close = 100 + Math.sin((index + 1) / 5) * 8;
  return {
    timestamp: 1_720_000_000_000 + index * 60_000,
    open,
    high: Math.max(open, close) + 2,
    low: Math.min(open, close) - 2,
    close,
    volume: 10 + index,
  };
});

const chartId = 'panes';
const panes: ChartPaneOptions[] = [
  {
    paneId: 'main',
    heightWeight: 3,
    priceScale: { priceScaleId: 'main' },
  },
  {
    paneId: 'volume',
    heightWeight: 1,
    minHeight: 56,
    priceScale: {
      priceScaleId: 'volume',
      valueFormat: { type: 'volume', precision: 1 },
    },
  },
];

export function Example() {
  useEffect(() => {
    TradingCharts.setHistory(chartId, history);
  }, []);

  return (
    <TradingChartsView
      style={{ height: 480 }}
      chartId={chartId}
      panes={panes}
      panesResizable
      additionalSeries={[
        {
          seriesId: 'volume',
          type: 'histogram',
          paneId: 'volume',
          priceScaleId: 'volume',
          source: { type: 'ohlcvVolume', seriesId: 'main' },
        },
      ]}
    />
  );
}
Resize panes
Enable panesResizable to drag separators. It defaults to enabled for multiple panes. onPaneResize reports both adjacent weights and whether the drag finished. Use TradingCharts.setPaneHeight(chartId, paneId, heightWeight) for a programmatic change; weights must be finite and positive. All panes share the horizontal viewport, while each has one visible price scale.
Pane scale formats and margins control their presentation; style their axis text with appearance.yAxis.text. Declare panes before adding runtime series that target them.