Data & streaming
A chart needs an initial price history, then updates as new market data arrives. This library stores that data in the native chart. Your app fetches it from an API or subscribes to a feed, then sends it to the chart through TradingCharts.
Feeds usually provide either candles or individual trades. A candle summarizes an interval with its open, high, low and close prices, plus optional volume (OHLCV). A trade is one executed price and size at a particular time. If your feed already supplies candles, load them with setHistory and keep the last candle current with updateCandle. If it supplies trades, send them with updateTrade or updateTrades; the native engine groups them into candles using your chosen resolution.
For example, a one-minute chart can load yesterday's candles once and update the current minute as trades arrive. It can fetch earlier candles when the user pans left. You do not need to send the entire history on every update. Independent histogram values, such as a custom volume delta, use HistogramPoint data on an additional series.
Data shapes
OhlcCandle
One candle summarizes prices over an interval. Use this shape for the main series and any additional series with its own price history. Include volume when your feed supplies it.
| Property | Type / values | Default | Description |
|---|---|---|---|
timestamp | Non-negative safe-integer milliseconds | Required | Candle timestamp. History must be strictly increasing. |
open | Finite number | Required | Opening price. |
high | Finite number | Required | Highest price. |
low | Finite number | Required | Lowest price. |
close | Finite number | Required | Closing price. |
volume | Finite number | 0 | Traded volume. Native storage cannot distinguish omitted volume from zero. |
TradeEvent
One trade records an executed price, timestamp and optional size. Send this shape when you want the native engine to build candles from individual executions.
| Property | Type / values | Default | Description |
|---|---|---|---|
timestamp | Non-negative safe-integer milliseconds | Required | Trade time; batches must be non-decreasing. |
price | Finite number | Required | Executed trade price. |
size | Finite number | 0 | Executed size added to candle volume. |
HistogramPoint
A histogram point is one numeric value at a timestamp. Use it for an independent histogram, such as a value your app calculates. Derived volume can read the candle volume directly instead.
| Property | Type / values | Default | Description |
|---|---|---|---|
timestamp | Non-negative safe-integer milliseconds | Required | Bar timestamp; arrays must be strictly increasing. |
value | Finite number | Required | Positive or negative histogram value. |
Loading and updating data
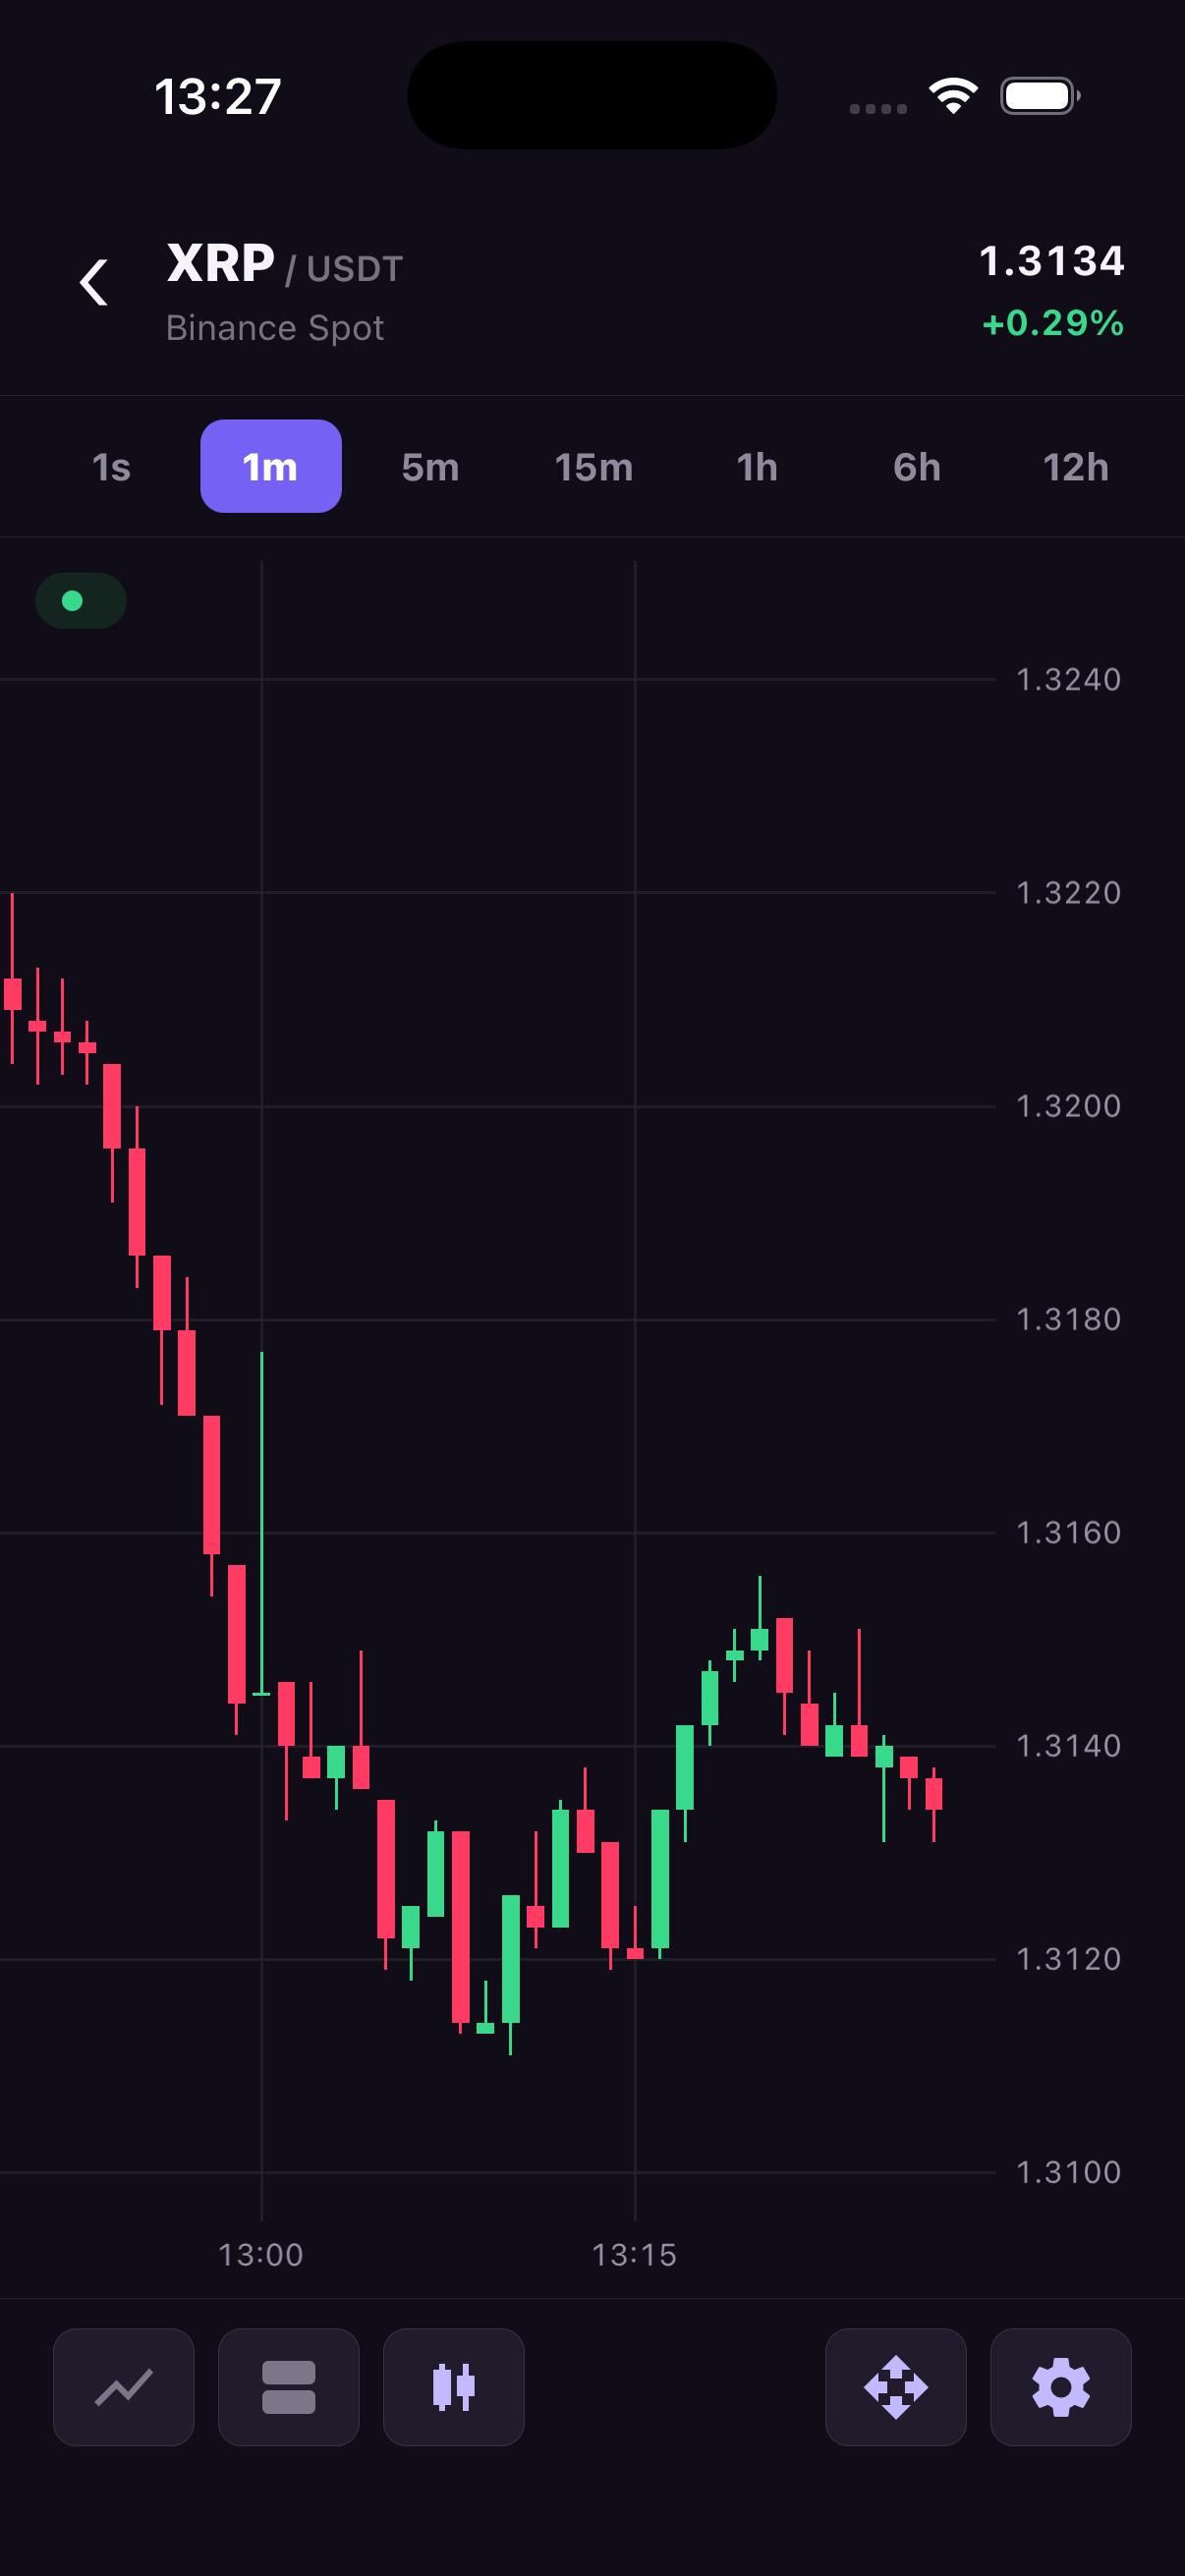
Load history once, then send only the changes your feed produces. prependHistory adds older candles during pagination. The series-data methods perform the corresponding operations on an additional series.
| Method | Arguments | Returns | Description |
|---|---|---|---|
setHistory | chartId, OhlcCandle[] | void | Replaces main history and restores configured initial scales. |
prependHistory | chartId, OhlcCandle[] | void | Prepends older, strictly ordered main history. |
updateCandle | chartId, OhlcCandle | void | Replaces the last candle at the same timestamp or appends a newer candle. |
updateTrade | chartId, TradeEvent | void | Aggregates one raw trade using the configured resolution. |
updateTrades | chartId, TradeEvent[] | void | Aggregates a non-decreasing batch in one native call. |
setSeriesData | chartId, seriesId, points[] | void | Replaces an additional series data set. |
prependSeriesData | chartId, seriesId, points[] | void | Prepends older additional-series data. |
updateSeriesData | chartId, seriesId, point | void | Replaces the last point or appends a newer one. |
Ready candles keep their feed-provided timestamps; they are not forced onto raw trade buckets. setHistory and prependHistory require strictly increasing timestamps. Trade batches allow equal timestamps but not decreasing ones. The engine does not create candles for intervals with no trades. It ignores trades older than the current aggregation bucket.
Candle updates
A candle can change while its interval is still open. Send the full replacement with the same timestamp; when the next interval starts, send a later timestamp to append it.
import { TradingCharts, type OhlcCandle } from 'react-native-trading-charts';

export function loadAndUpdate(chartId: string) {
  const candle: OhlcCandle = {
    timestamp: 1_720_000_000_000,
    open: 100,
    high: 104,
    low: 99,
    close: 102,
    volume: 12,
  };
  TradingCharts.setHistory(chartId, [candle]);
  // The same timestamp replaces the last candle, including its volume.
  TradingCharts.updateCandle(chartId, {
    ...candle,
    high: 106,
    close: 105,
    volume: 15,
  });
  // A later timestamp appends a candle.
  TradingCharts.updateCandle(chartId, {
    ...candle,
    timestamp: candle.timestamp + 60_000,
  });
}
All prices must be finite; high >= max(open, close) and low <= min(open, close). Optional volume and trade size must be finite and non-negative. Use the same data shape for every point in an array; do not mix OHLC candles and histogram points. Validation errors throw TypeError in JavaScript.
Stream raw trades
Pass your feed subscription to this component. It adds each incoming trade to the batcher and unsubscribes when the component unmounts. Keep the history array and subscribe function stable between renders so the effect does not keep replacing history and restarting the subscription.
import { useEffect } from 'react';
import {
  createTradeBatcher,
  TradingCharts,
  TradingChartsView,
  type OhlcCandle,
  type TradeEvent,
} from 'react-native-trading-charts';

type Props = {
  chartId: string;
  history: readonly OhlcCandle[];
  // Your feed adapter returns its unsubscribe function.
  subscribe: (onTrade: (trade: TradeEvent) => void) => () => void;
};

export function StreamingChart({ chartId, history, subscribe }: Props) {
  useEffect(() => {
    TradingCharts.setHistory(chartId, history);
    const batcher = createTradeBatcher(chartId, { intervalMs: 32 });
    const unsubscribe = subscribe((trade) => batcher.add(trade));
    return () => {
      unsubscribe();
      batcher.dispose();
    };
  }, [chartId, history, subscribe]);

  return (
    <TradingChartsView
      style={{ height: 420 }}
      chartId={chartId}
      resolution={{ unit: 'minute' }}
    />
  );
}
Load older history
Fetch strictly older candles when the viewport reaches the left boundary. Guard concurrent requests and stop after an empty page. This example reads the actual first stored candle before requesting a page; event.from is a viewport boundary, not a pagination cursor.
Keep chartId and initialHistory stable for this component's lifetime. Remount it with a new React key when switching instruments so pending work cannot update the next chart.
import { useCallback, useEffect, useRef, useState } from 'react';
import { Text, View } from 'react-native';
import {
  TradingCharts,
  TradingChartsView,
  type OhlcCandle,
  type VisibleRangeChangeEvent,
} from 'react-native-trading-charts';

type Props = {
  chartId: string;
  initialHistory: readonly OhlcCandle[];
  // Return older candles only, ordered from oldest to newest. [] means exhausted.
  loadOlder: (before: number) => Promise<readonly OhlcCandle[]>;
};

export function HistoryChart({ chartId, initialHistory, loadOlder }: Props) {
  const loading = useRef(false);
  const exhausted = useRef(false);
  const mounted = useRef(false);
  const [error, setError] = useState<string | null>(null);

  useEffect(() => {
    mounted.current = true;
    TradingCharts.setHistory(chartId, initialHistory);
    return () => {
      mounted.current = false;
    };
  }, [chartId, initialHistory]);

  const load = useCallback(async () => {
    if (loading.current || exhausted.current) return;
    loading.current = true;
    setError(null);
    try {
      const candles = await TradingCharts.getCandles(chartId);
      const first = candles[0];
      if (!first || !mounted.current) return;
      const older = await loadOlder(first.timestamp);
      if (!mounted.current) return;
      exhausted.current = older.length === 0;
      TradingCharts.prependHistory(chartId, older);
    } catch (cause) {
      if (mounted.current) {
        setError(
          cause instanceof Error ? cause.message : 'Unable to load history'
        );
      }
    } finally {
      loading.current = false;
    }
  }, [chartId, loadOlder]);

  const onRangeChange = useCallback(
    (event: VisibleRangeChangeEvent) => {
      if (event.atStart) void load();
    },
    [load]
  );

  return (
    <View>
      <TradingChartsView
        style={{ height: 420 }}
        chartId={chartId}
        initialVisibleCount={40}
        onVisibleRangeChange={onRangeChange}
      />
      {error ? (
        <Text
          onPress={() => {
            void load();
          }}
        >
          {error} — tap to retry
        </Text>
      ) : null}
    </View>
  );
}
A data gap suppresses visible-range events. An empty chart therefore needs its initial history loaded independently of these events. A failed request can be retried without overlapping another request.
Read and clear
getCandles returns a copy of the main candle history captured at a single point in time. clear removes market data while preserving custom price markers. Read methods require a mounted chart; write commands sent before mount wait in a queue with a size limit. A queued setHistory replaces older queued work, and the oldest streaming commands may be dropped when the queue is full.