Bollinger Bands (BOLL)
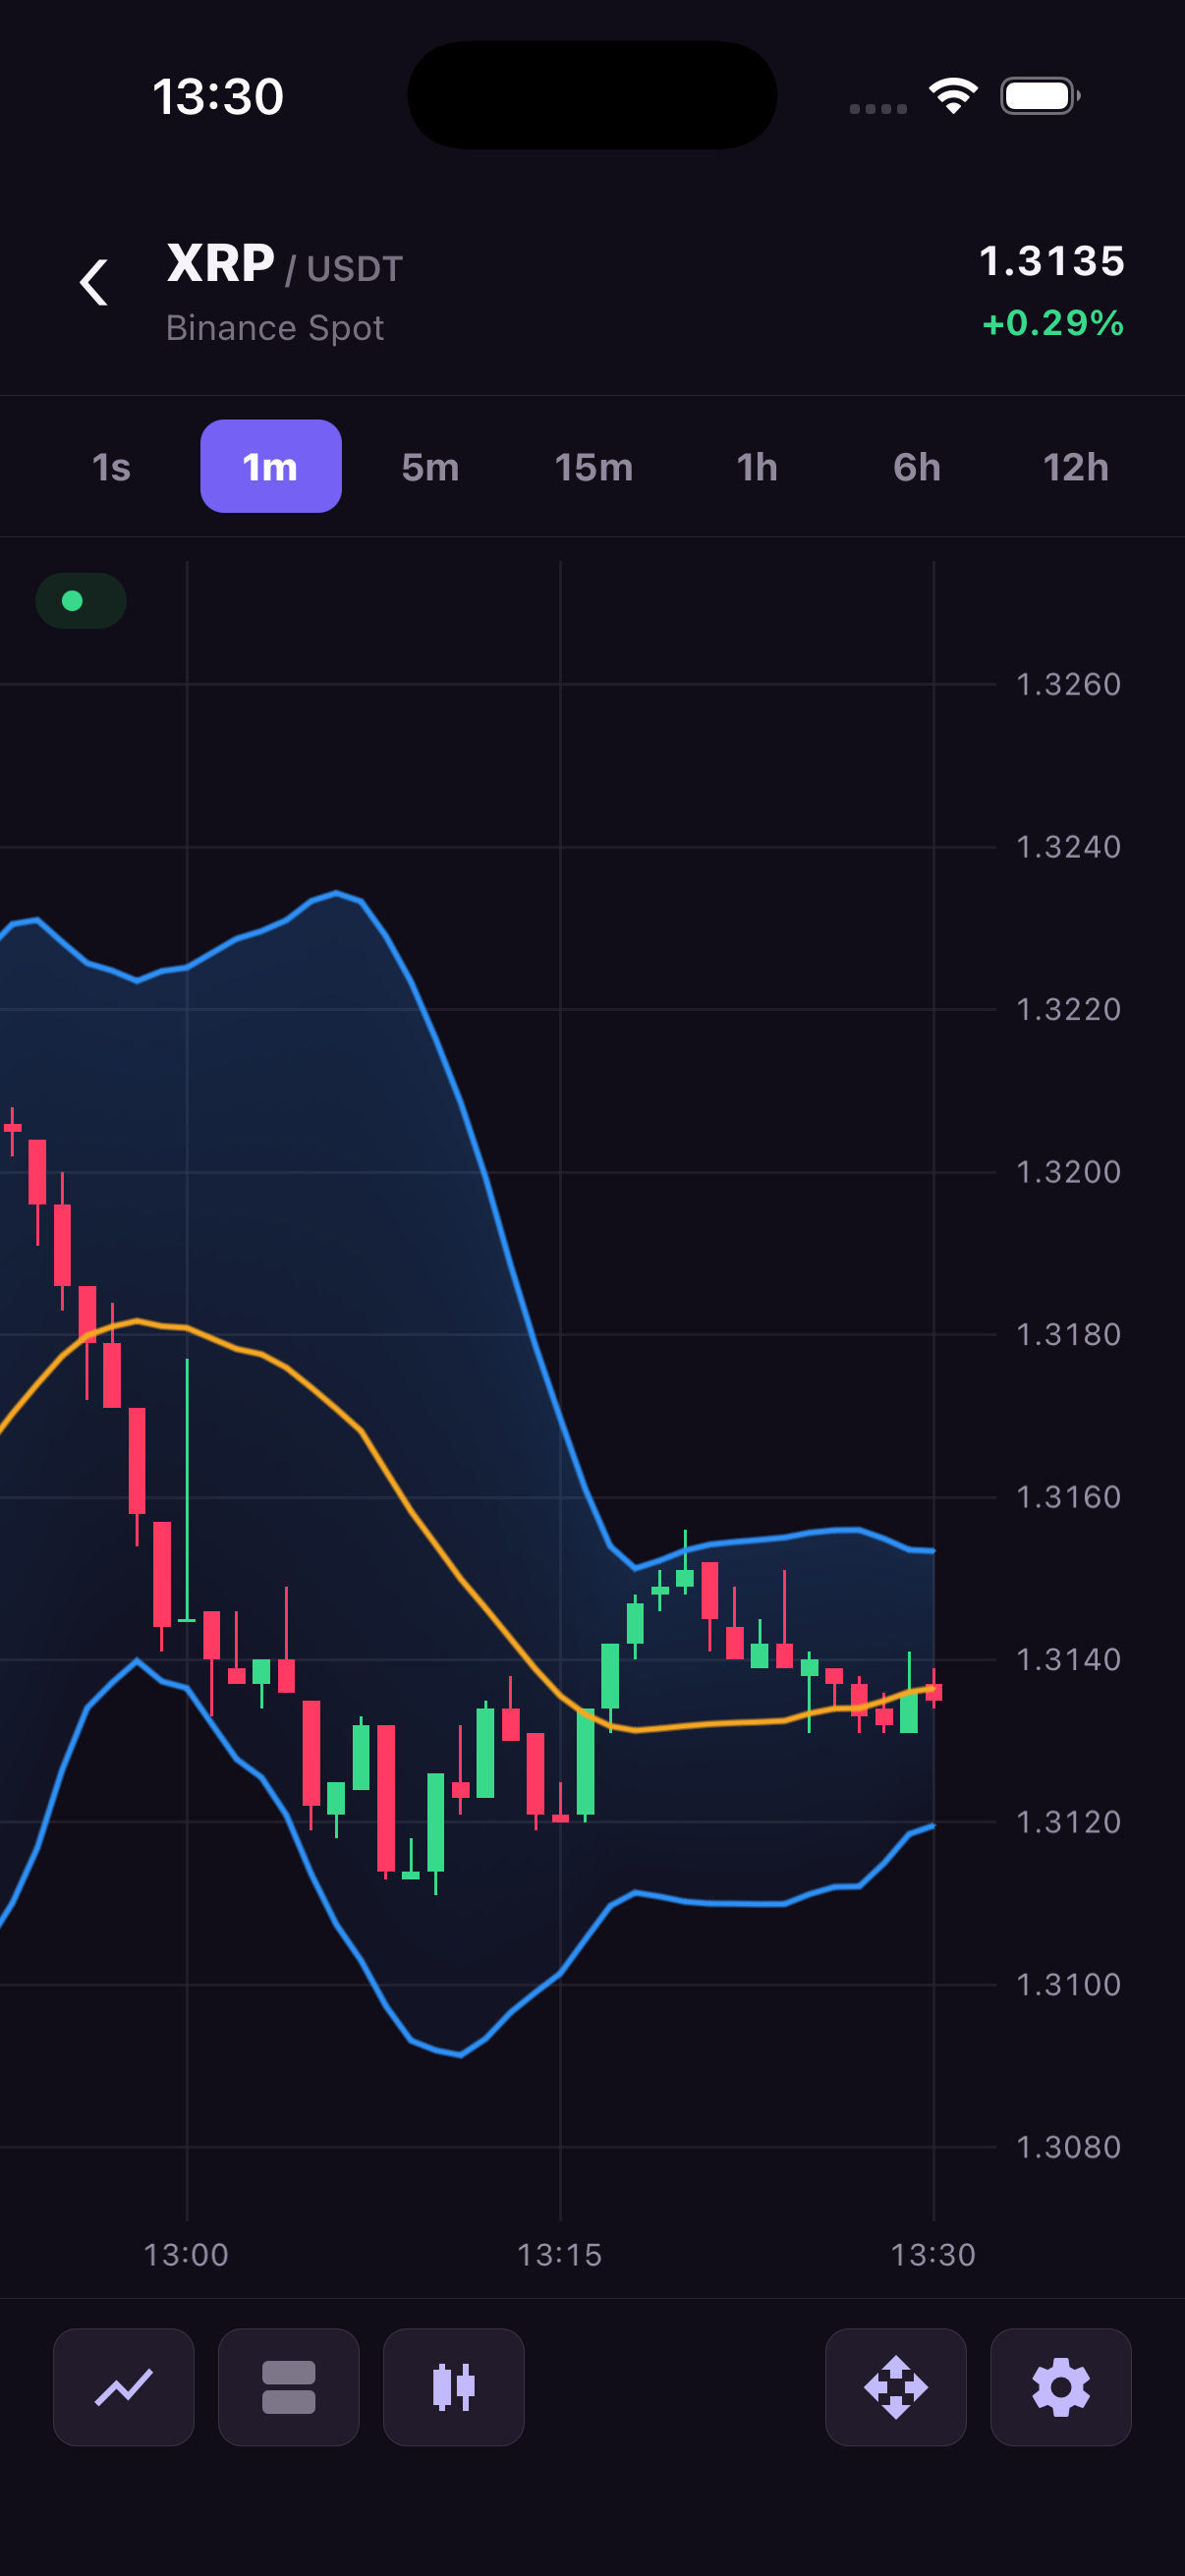
BOLL draws a simple moving average and two bands around it on the source price pane. The shared C++ engine calculates all three values from the source OHLC candles and updates them when history, candles, or trades change.
For a window of N prices and multiplier K:
middle = sum(price) / Nsigma = sqrt(sum((price - middle)²) / N)(population standard deviation)upper = middle + K × sigmalower = middle - K × sigma
The defaults are N = 20, K = 2, and closing prices, following the conventional Bollinger Bands definition. No values are published before candle index N - 1. With period 1, all three lines coincide with the selected price.
Configuration
import { TradingChartsView, TradingCharts, type BollSeriesOptions } from 'react-native-trading-charts';

const boll: BollSeriesOptions = {
  seriesId: 'boll',
  type: 'boll',
  paneId: 'main',
  priceScaleId: 'main',
  source: {
    type: 'ohlcvBoll',
    seriesId: 'main',
    period: 20,
    stdDevMultiplier: 2,
    valueSource: 'close',
  },
  appearance: {
    upperLine: { color: '#2E90F5', width: 1, style: 'solid' },
    middleLine: { color: '#F5A623', width: 1, style: 'dashed' },
    lowerLine: { color: '#2E90F5', width: 1 },
    fill: { enabled: true, topColor: '#2E90F533', bottomColor: '#2E90F50D' },
  },
};

// Declarative: pass the series as chart configuration.
<TradingChartsView chartId="prices" additionalSeries={[boll]} />;

// Alternatively, add it imperatively (do not add the same ID twice).
TradingCharts.addSeries('prices', boll);| Option | Values | Default |
|---|---|---|
source.period | Integer 1…4294967295 | 20 |
source.stdDevMultiplier | Finite positive number, including fractions | 2 |
source.valueSource | open, high, low, close | close |
visible | Boolean | true |
gapThresholdMs | Positive milliseconds | Continuous path |
appearance.upperLine, middleLine, lowerLine | ChartLineAppearance | Width 1, solid; blue bands, orange middle |
appearance.fill.enabled | Boolean | true |
appearance.fill.topColor | HEX color with optional alpha | #2E90F533 |
appearance.fill.bottomColor | HEX color with optional alpha | #2E90F50D |
Each line accepts its own color, width, style, and optional vertical gradient: { topColor, bottomColor }. Fill colors interpolate from the upper band to the lower band. Equal fill colors produce a solid fill; #RRGGBBAA sets opacity. The fill appears beneath price geometry, with the three lines above it. Visible band bounds participate in autoscale.
The source must be main or a data-backed OHLC series with the same paneId and priceScaleId. Derived indicators cannot be sources. gapThresholdMs breaks both lines and fill without restarting the rolling calculation. A period counts actual candles, not synthesized empty time buckets.
Crosshair values
onSelectedCandleChange includes a CrosshairSeriesValue with kind: 'boll', seriesType: 'boll', sourceType: 'ohlcvBoll', and upper, middle, lower. Values are null during warmup or when the source has no candle at the selected timestamp. Hidden BOLL series are omitted. The chart does not draw a BOLL legend.
In the example, open Chart settings → BOLL. Enable the indicator, edit its period and deviation multiplier, choose the price source, and adjust each line and the fill. Numeric changes apply when editing ends; invalid input leaves the previous configuration active. Restore defaults disables BOLL and restores its defaults.