Introduction
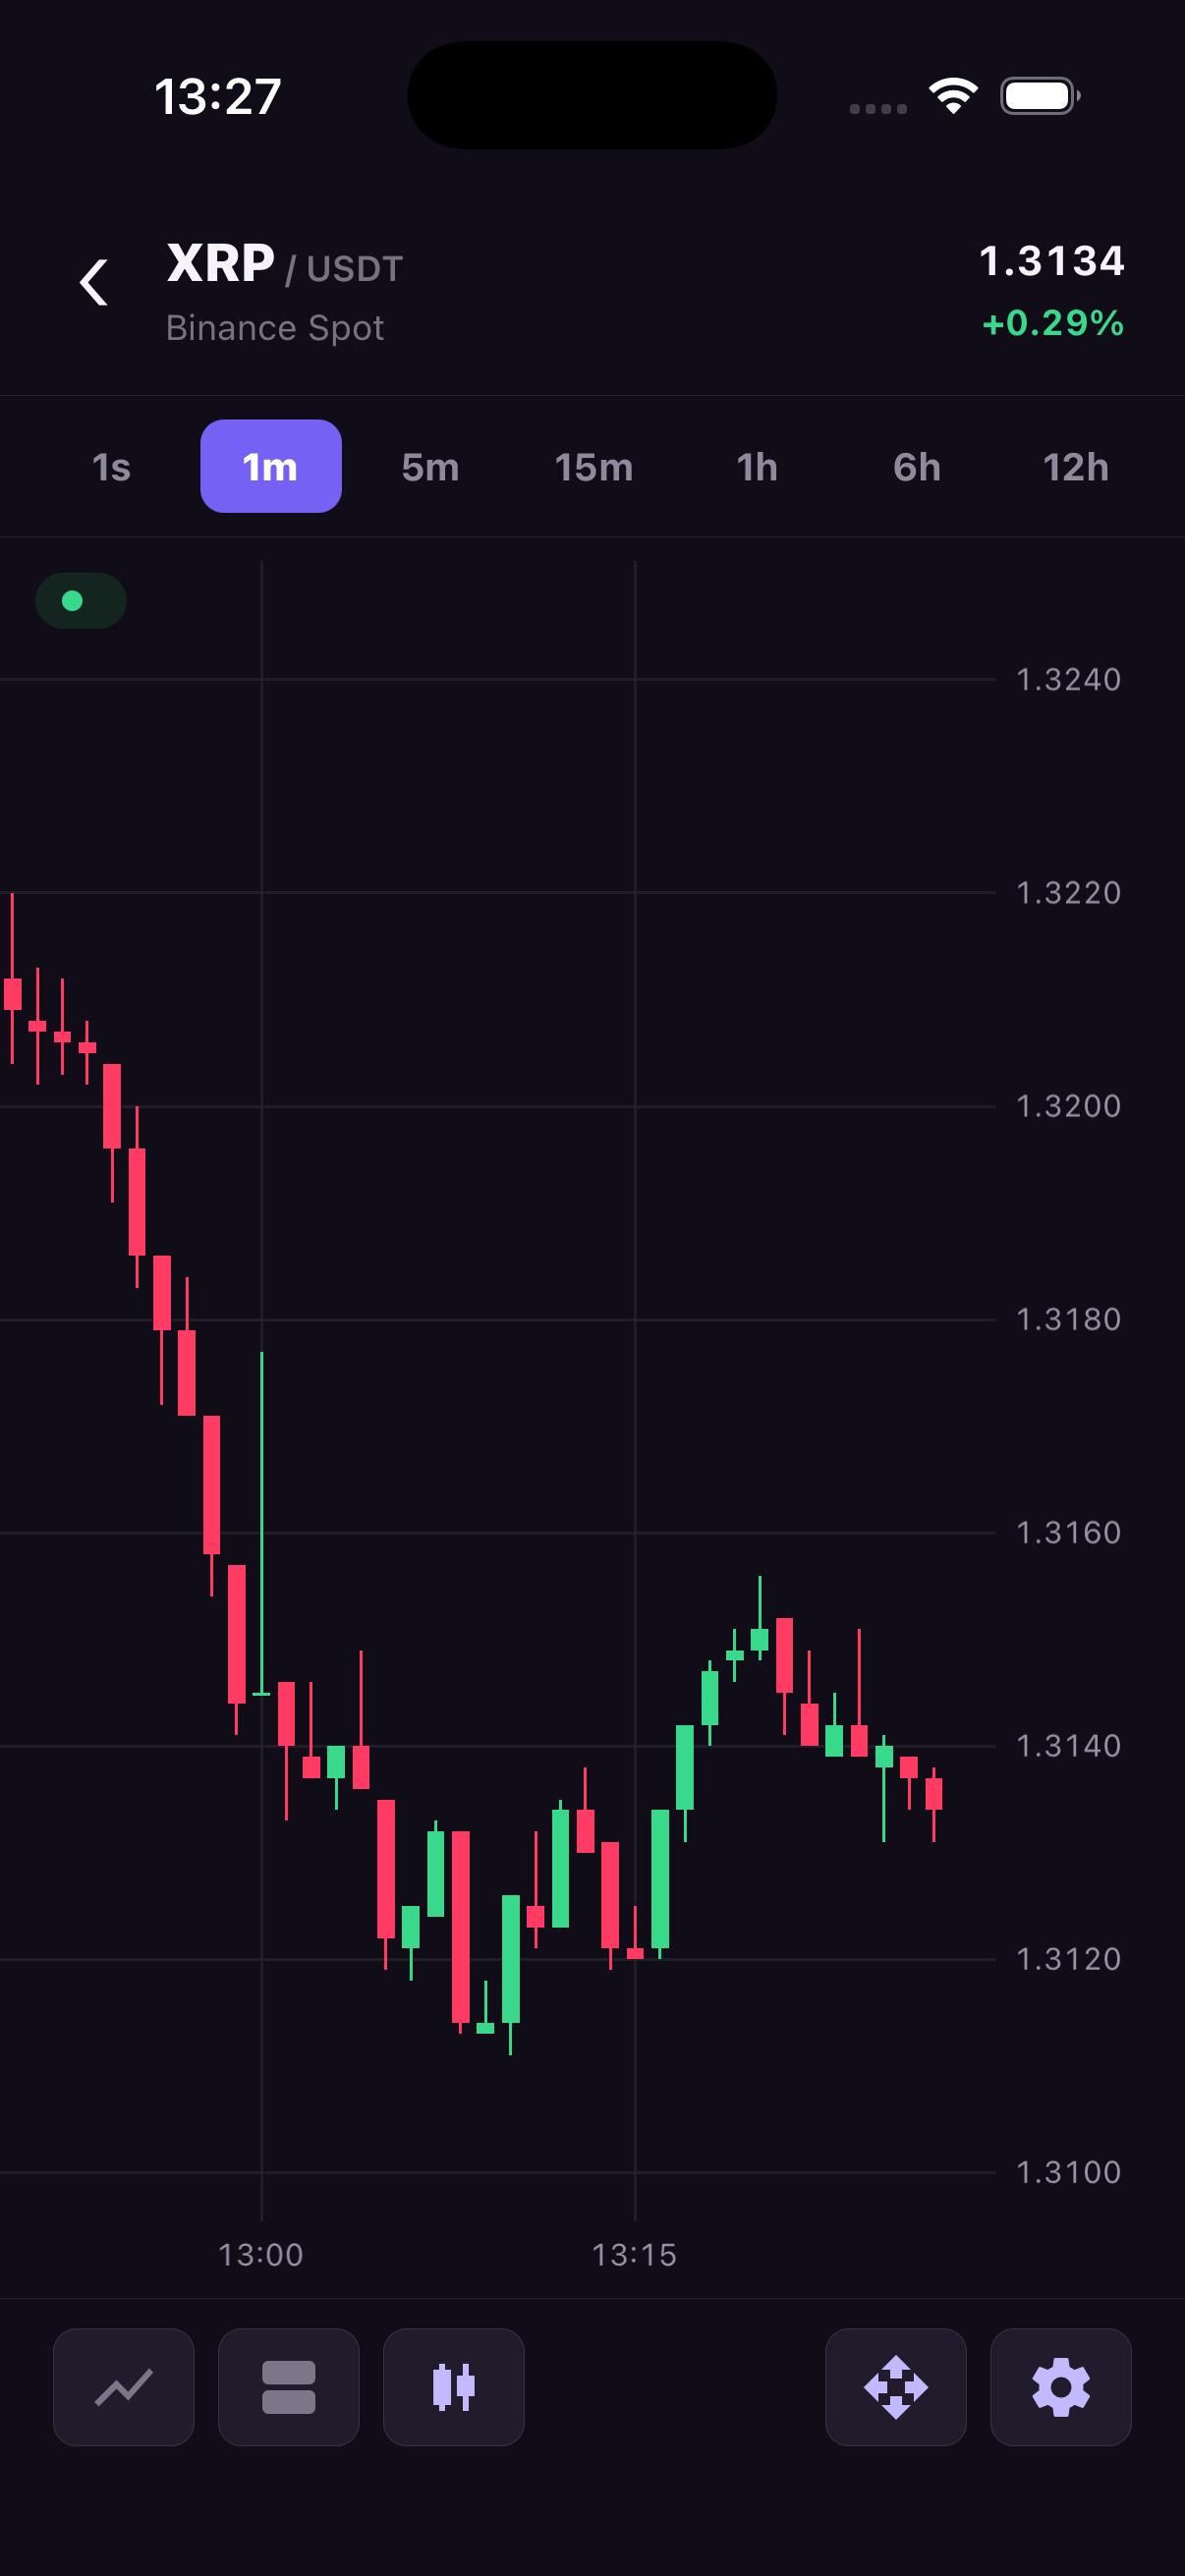
react-native-trading-charts draws historical and live market data in React Native apps on iOS and Android. Use it for a price screen where users need to inspect candles, follow incoming trades or compare price with volume and indicators.
Your app supplies the data and React configuration. The native chart stores the candles, handles gestures and draws the result. It uses a shared C++ engine with Metal on iOS and OpenGL ES 3 on Android. The package adds no runtime dependencies beyond its React and React Native peers; it does not embed a browser or a general-purpose graphics framework.
Build a chart around your data
Start with a main price series. Candlesticks and OHLC bars show prices within each interval; line and area series give a simpler view of one price field. You can change the main display type without replacing its history.
Add a comparison series when you have another set of OHLC data. For volume, SMA, EMA, RSI or MACD, the native engine can calculate values from an existing series. Separate panes give indicators their own vertical scales while keeping timestamps aligned. You can also supply your own histogram values.
Use theme colors for the overall appearance, then style individual axes, badges and tooltips where needed. Native date and number formatting controls the labels. Users can pan, pinch, resize panes, adjust vertical scales and select candles with a crosshair. The chart also displays the latest price and visible high and low values.
Connect the view to a feed
TradingChartsView places the chart in your screen and configures it. TradingCharts sends history, updates and commands to that view using its unique, stable chartId. Send complete candles if your feed already groups trades, or send raw trades for native aggregation. The trade batcher groups frequent messages into fewer native calls.
The app owns network requests, authentication, subscriptions and reconnection. The library starts with the data you send it. The installation guide includes sample data so you can render a first chart before connecting a feed.
What runs natively
The shared engine handles candle storage, aggregation, visible ranges, automatic scaling, ticks, selection and geometry on both platforms. Each platform draws with its native GPU API and text system.
Rendering happens when state changes. The engine reuses unchanged snapshots, and moving only the crosshair can reuse the chart's existing geometry. The library requires React Native New Architecture and supports native iOS and Android charts; see platform requirements before integrating it.